Higher inflation to drive stocks lower – A new downtrend?

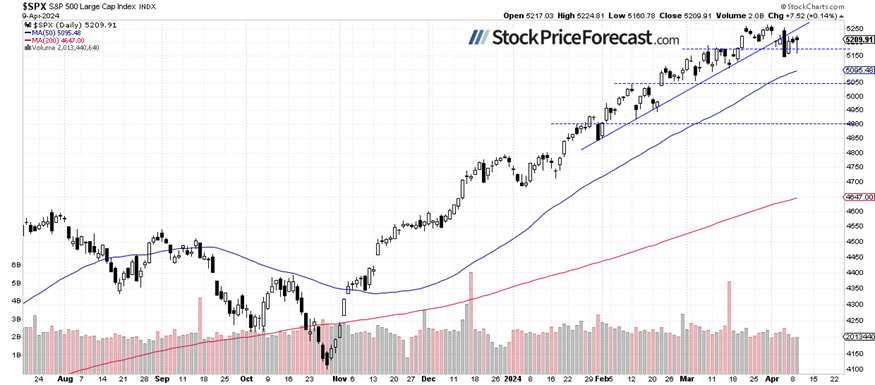
Stock prices kept going sideways yesterday, with the S&P 500 index gaining 0.14% after an intraday dip, followed by a rebound from 5,160 level. The market awaited today’s Consumer Price Index release, and this morning, the number came higher than expected at +0.4% month over month. The futures contract is pointing to 1.3% decline at the open for the S&P 500 index.
Last Tuesday, in my Stock Price Forecast for April, I noted, “Closing the month of March with a gain of 3.1%, the question arises: Will the S&P 500 further extend the bull market in April, or is a downward correction on the horizon? From a contrarian standpoint, such a correction seems likely, but the overall trend remains bullish.”
The investor sentiment has slightly worsened a week ago, as indicated by the last Wednesday’s AAII Investor Sentiment Survey, which showed that 47.3% of individual investors are bullish, while only 22.2% of them are bearish. The AAII sentiment is a contrary indicator in the sense that highly bullish readings may suggest excessive complacency and a lack of fear in the market. Conversely, bearish readings are favorable for market upturns.
Today, the S&P 500 is likely to extend a correction and break below the 5,200 level again. On Thursday, it broke its two-month-long upward trend line, as we can see on the daily chart.
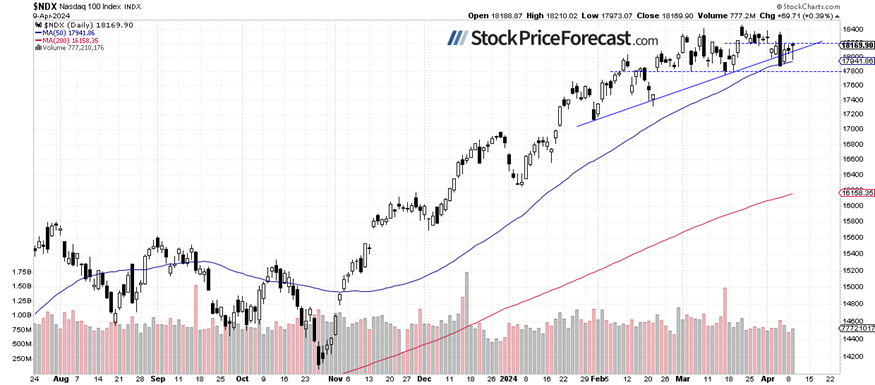
Nasdaq 100 remained above 18,000
The technology-focused Nasdaq 100 index continued to trade above the 18,000 level, extending its two-month-long consolidation yesterday. Last week, the market went closer to its local lows from February and March, before rebounding back above 18,000. Today, the Nasdaq index is likely to open lower, breaking below the recent lows.
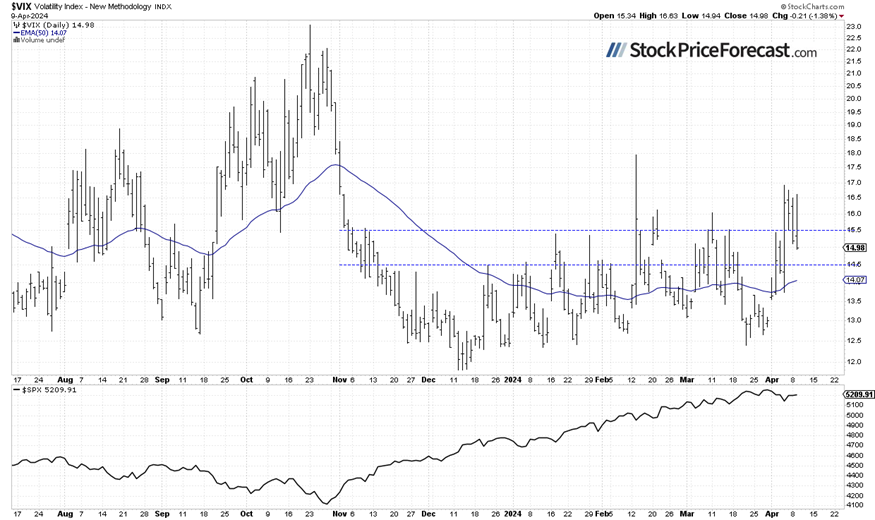
VIX remains close to 15
The VIX index, also known as the fear gauge, is derived from option prices. In late March, it was trading around the 13 level, and last week, market volatility increased, leading to an advance towards 17. Since then, it has been fluctuating within a range of 15-17, indicating an uncertainty.
Historically, a dropping VIX indicates less fear in the market, and rising VIX accompanies stock market downturns. However, the lower the VIX, the higher the probability of the market’s downward reversal.
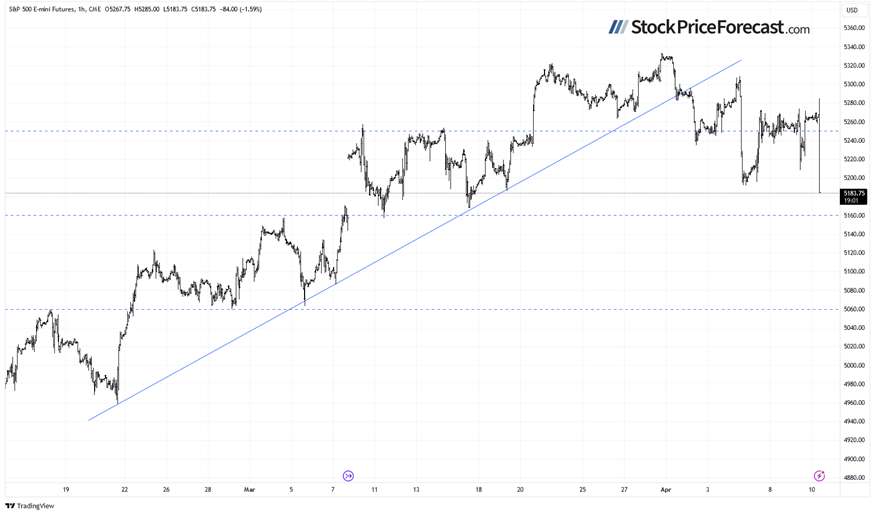
Futures contract breaking lower
Let’s take a look at the hourly chart of the S&P 500 futures contract. On Thursday, it sold off to around 5,200, and on Friday, it bounced to around 5,270 following monthly jobs data release. This morning, it is lower again, breaking the 5,200 level. The next support is at 5,160-5,180.
Conclusion
Wednesday’s trading session is likely to open on a negative note following the CPI number release. The S&P 500 index will break below its Thursday’s low, and it will retrace more of the March rally.
Investors will be waiting for more economic data, including key Advance GDP release on Thursday. It’s also worth noting that the earnings season is approaching in mid-month. On Friday, major banks will release their quarterly reports.
Last Tuesday, I wrote that “In April, we will see a usual series of important economic data, but with the Fed leaning towards easing monetary policy, we should perhaps pay more attention to the quarterly earnings season. However, good earnings may be met with a profit-taking action this time. The market appears to be getting closer to a correction.”
On Thursday, I added: “It appears that profit-taking is happening. Is this a new downtrend? Likely not, however, a correction towards 5,000-5,100 is possible at some point.”
For now, my short-term outlook remains neutral.
Here’s the breakdown:
-
The S&P 500 is likely to open much lower following the CPI release.
-
In the medium term, stock prices remain somewhat overbought, suggesting the potential for a correction.
-
In my opinion, the short-term outlook is neutral.
The full version of today’s analysis - today’s Stock Trading Alert - is bigger than what you read above, and it includes the additional analysis of the Apple (AAPL) stock and the current S&P 500 futures contract position. I encourage you to subscribe and read the details today. Stocks Trading Alerts are also a part of our Diamond Package that includes Gold Trading Alerts and Oil Trading Alerts.
Want free follow-ups to the above article and details not available to 99%+ investors? Sign up to our free newsletter today!
Want free follow-ups to the above article and details not available to 99%+ investors? Sign up to our free newsletter today!
Author

Paul Rejczak
Sunshine Profits
Paul Rejczak is a stock market strategist who has been known for the quality of his technical and fundamental analysis since the late nineties.


