High-frequency trading signal the next buying opportunity in Delta Air Lines (DAL)

Elliott Wave Theory states that market trends unfold in five impulsive waves and correct in three waves. Building on this foundation, EWF has developed an enhanced and more systematic approach to Elliott Wave analysis by integrating wave sequences and high-frequency trading concepts,. We discussed this topic in our article The Elliott Wave Theory and High-Frequency Trading. This evolution of the theory allows us to identify higher-probability entry zones with greater precision and consistency for our members. We will utilize this concept in evaluating Delta Airlines (DAL).
Financial markets do not operate in isolation. Rather, they move as a unified system. As a result, our methodology begins by identifying dominant market cycles and correlating them across multiple instruments. This process enables us to isolate a “middle group” of instruments that align with the prevailing cycle and position ourselves on the right side of the market. The underlying principle remains that trends develop in five waves, and within each five-wave structure, there exists a smaller-degree five-wave formation. This fractal repetition is central to Elliott Wave Theory and forms the basis of our analytical framework.
A key enhancement in our approach is the use of wave sequences. When markets are trending or unfolding within an impulsive phase, sequences typically complete in 5, 9, or 13 swings. During corrective phases, sequences tend to complete in 3, 7, or 11 swings. When a sequence remains incomplete, the probability increases significantly that price will extend further in the same direction to complete that sequence. We therefore monitor every swing closely, focusing on identifying incomplete sequences as high-probability trading opportunities.
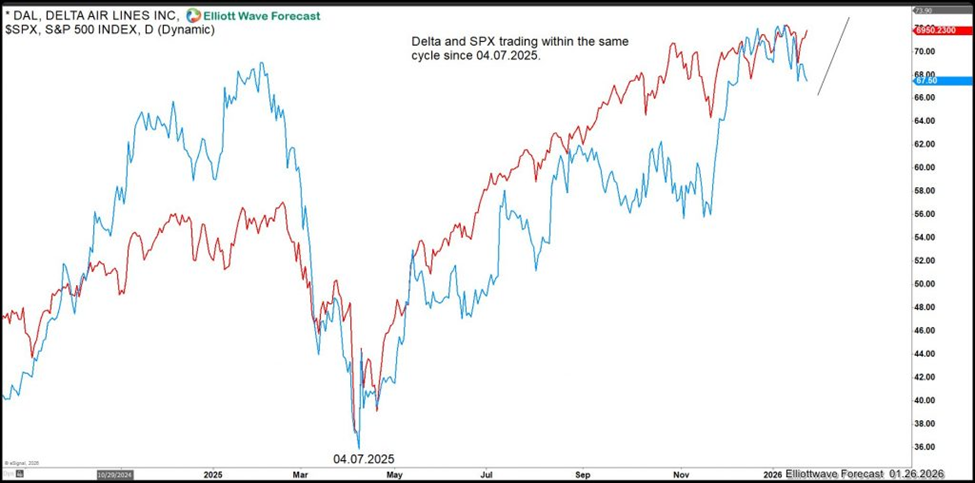
The broader market context supports this approach. The chart of $DAL and $SPX from the lows of April 7, 2025, illustrates a synchronized daily cycle across most risk assets. By analyzing these charts collectively, we are able to define the prevailing cycle and then scan individual instruments for incomplete sequences. When such conditions are present, we consistently anticipate extensions in the direction of the dominant trend. Here is a Daily chart showing $SPX and $DAL since the lows at 04.07.2025.
$DAL and $SPX show synchronized daily cycle
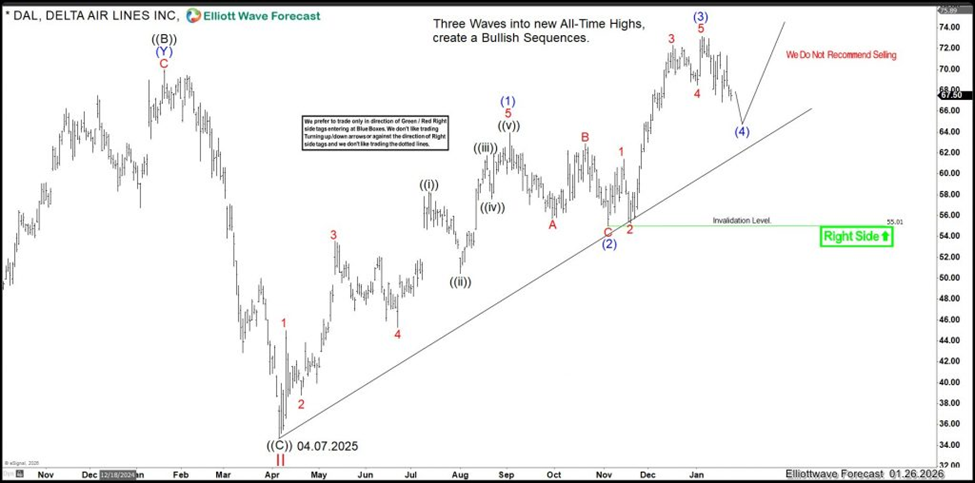
Focusing specifically on Delta Air Lines ($DAL), the price action since the April 4, 2025 low has unfolded in three waves into new highs. According to Elliott Wave Theory, a sustained trend cannot terminate in three waves; trends must complete in five waves. Therefore, we are comfortable looking for buying opportunities during corrective phases consisting of three, seven, or eleven swings, measured against the wave ((2)) lows. Here is the latest Daily chart showing the idea.
$DAL monthly Elliott Wave chart
To further refine risk management, we have developed a pivot-based system that identifies potential market traps, such as flat corrections. A flat is the only Elliott Wave structure that allows three waves into new all-time highs; however, even in such cases, the broader directional bias remains intact. This system helps us distinguish between corrective noise and genuine trend changes.
Currently, Delta Air Lines presents an incomplete sequence, making it an ideal candidate for applying high-frequency precision to trend entries. The structure from the recent peak is unfolding as a WXY corrective pattern, which consists of seven swings. Based on this structure, our proprietary methodology identifies a high-probability buying zone—the Blue Box area between $65.37 and $61.37. From this region, Delta Air Lines has a statistically higher likelihood of resuming the primary uptrend. Here is the 4H chart showing the High-Frequency (Blue Box) area.
Author

Elliott Wave Forecast Team
ElliottWave-Forecast.com


