Hang Seng Index Elliott Wave technical analysis [Video]
![Hang Seng Index Elliott Wave technical analysis [Video]](https://editorial.fxstreet.com/images/Markets/Equities/HangSeng/hang-seng-index-17452117_XtraLarge.jpg)
Hang Seng Index Elliott Wave technical analysis
Function: Trend
Mode: Corrective
Structure: Orange wave 2
Position: Navy blue wave 3
Direction next higher degrees: Orange wave 3
Details: Orange wave 2 still in play, nearing end. Orange wave 3 will start next.
Wave cancel invalid level: 16044.39
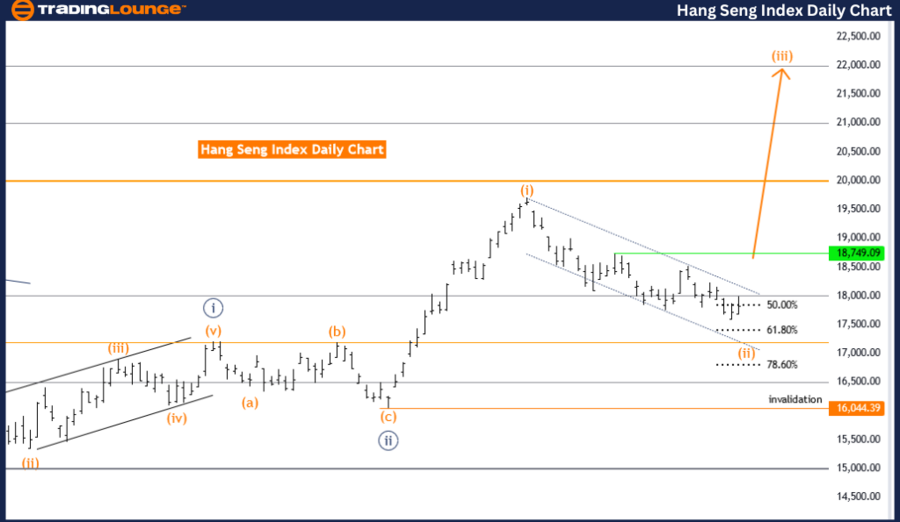
The Hang Seng Index Elliott Wave analysis on the daily chart indicates the market is currently in a corrective trend. This mode suggests a temporary reversal or correction rather than a continuation of the primary trend.
Structure analysis
- Current Structure: Orange wave 2
- In Elliott Wave Theory, wave 2 typically follows the initial impulse wave (wave 1). It usually retraces a significant portion of wave 1, setting the stage for wave 3.
- Current Position: Navy blue wave 3
- Indicates the market is expected to enter the third wave of the larger degree navy blue wave sequence. Wave 3 in any degree is typically the most powerful and provides significant directional movement in the trend's direction.
Direction for higher degrees
- Next Higher Degree: Orange wave 3
- After the completion of the current orange wave 2, the market is anticipated to start a strong upward movement as part of orange wave 3. Wave 3 is known for its strength and is often the most extended wave in the Elliott Wave cycle.
Current status
- Orange wave 2: Nearing its end
- This implies the corrective phase is almost complete, and the market is preparing to transition into orange wave 3, which will be an impulse wave moving in the direction of the primary trend.
Critical level
- Wave Cancel Invalid Level: 16044.39
- This level serves as a critical point; if the market moves beyond this level, the current wave count would be invalidated, necessitating a reevaluation of the wave structure.
Summary
The Hang Seng Index on the daily chart is in a corrective phase within orange wave 2. This wave is nearing completion, and the market is expected to start orange wave 3, indicating a strong upward movement. The wave cancel invalid level is 16044.39, beyond which the current analysis would need to be reassessed.
Hang Seng Index Elliott Wave four-hour chart
FUNCTION: Trend
MODE: Corrective
STRUCTURE: Orange wave 2
POSITION: Navy blue wave 3
DIRECTION NEXT HIGHER DEGREES: Orange wave 3
DETAILS: Orange wave 2 still in play, nearing end. Orange wave 3 will start next.
Wave Cancel Invalid Level: 16044.39
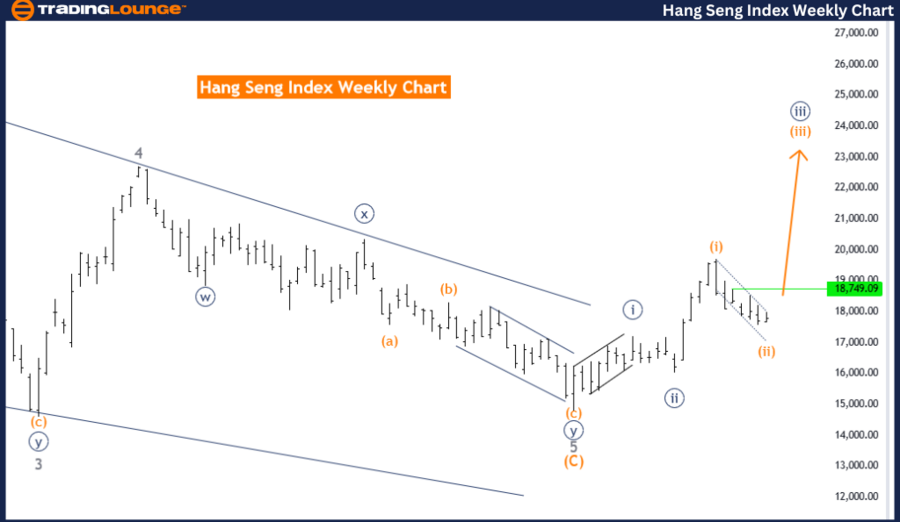
The Hang Seng Index Elliott Wave analysis on the weekly chart indicates the market is currently in a corrective trend. This mode suggests a temporary reversal or correction rather than a continuation of the primary trend.
Structure analysis
- Current Structure: Orange wave 2
- In Elliott Wave Theory, wave 2 typically follows the initial impulse wave (wave 1). It usually retraces a significant portion of wave 1, setting the stage for wave 3.
- Current Position: Navy blue wave 3
- Indicates the market is expected to enter the third wave of the larger degree navy blue wave sequence. Wave 3 in any degree is typically the most powerful and provides significant directional movement in the trend's direction.
Direction for higher degrees
- Next Higher Degree: Orange wave 3
- After the completion of the current orange wave 2, the market is anticipated to start a strong upward movement as part of orange wave 3. Wave 3 is known for its strength and is often the most extended wave in the Elliott Wave cycle.
Current status
- Orange wave 2: Nearing its end
- This implies the corrective phase is almost complete, and the market is preparing to transition into orange wave 3, which will be an impulse wave moving in the direction of the primary trend.
Critical level
- Wave Cancel Invalid Level: 16044.39
- This level serves as a critical point; if the market moves beyond this level, the current wave count would be invalidated, necessitating a reevaluation of the wave structure.
Summary
The Hang Seng Index on the weekly chart is in a corrective phase within orange wave 2. This wave is nearing completion, and the market is expected to start orange wave 3, indicating a strong upward movement. The wave cancel invalid level is 16044.39, beyond which the current analysis would need to be reassessed.
Hang Seng Index Elliott Wave technical analysis [Video]
Author

Peter Mathers
TradingLounge
Peter Mathers started actively trading in 1982. He began his career at Hoei and Shoin, a Japanese futures trading company.


