Grasim Industries Elliott Wave technical analysis [Video]
![Grasim Industries Elliott Wave technical analysis [Video]](https://editorial.fxstreet.com/images/TechnicalAnalysis/ChartPatterns/Chartism/financial-analysis-6085333.jpg)
GRASIM Elliott Wave technical analysis
Function: Larger Degree trend Higher (Intermediate degree, orange. Wave (5)).
Mode: Motive.
Structure: Impulse.
Position: Minute Wave ((iii)) Navy.
Details: Minute Wave ((iii)) Navy of Minor Wave 5 Grey progressing higher within Intermediate Wave (5) Orange against 2490. Alternatively, Wave (5) Orange is complete above 2900.
Invalidation point: 2490.
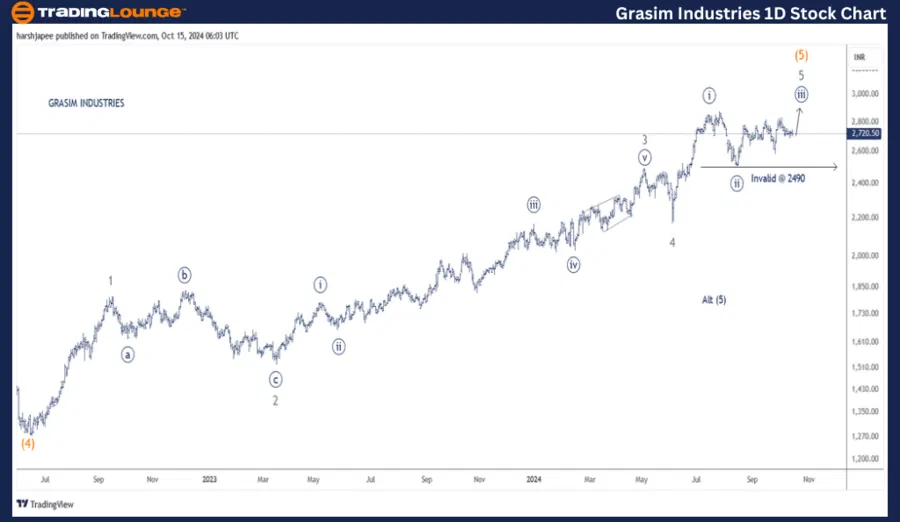
Grasim Industries daily chart technical analysis and potential Elliott Wave counts
Grasim Industries daily chart is indicating a progressive rally, which is unfolding Minute Wave ((iii)) Navy within Minor Wave 5 Grey of Intermediate Wave (5) Orange against 2490 support. Alternatively, Wave (5) Orange already terminated around 2900.
Grasim Industries has produced a religious uptrend since June 2022 lows around 1270 mark, Intermediate Wave (4) termination. The sub waves are potentially unfolding into five waves marked as Minor Waves 1 through 5 (still unfolding) Grey here.
If the above holds well, the stock could be well underway to push above the 3000 mark and terminate Intermediate Wave (5) Orange. Ideally, prices should stay above 2450, Minute Wave ((ii)) termination, to keep the bullish structure intact.
GRASIM Elliott Wave technical analysis
Function: Larger Degree trend Higher (Intermediate degree, orange. Wave (5)).
Mode: Motive.
Structure: Impulse.
Position: Minute Wave ((iii)) Navy.
Details: Minute Wave ((iii)) Navy of Minor Wave 5 Grey progressing higher within Intermediate Wave (5) Orange against 2490. Furthermore, Minuette Wave (ii) Orange within Minute Wave ((iii)) Navy looks complete around 2700 mark. If correct, Minuette Wave (iii) should be underway. Alternatively, Wave (5) Orange is complete above 2900.
Invalidation point: 2490.
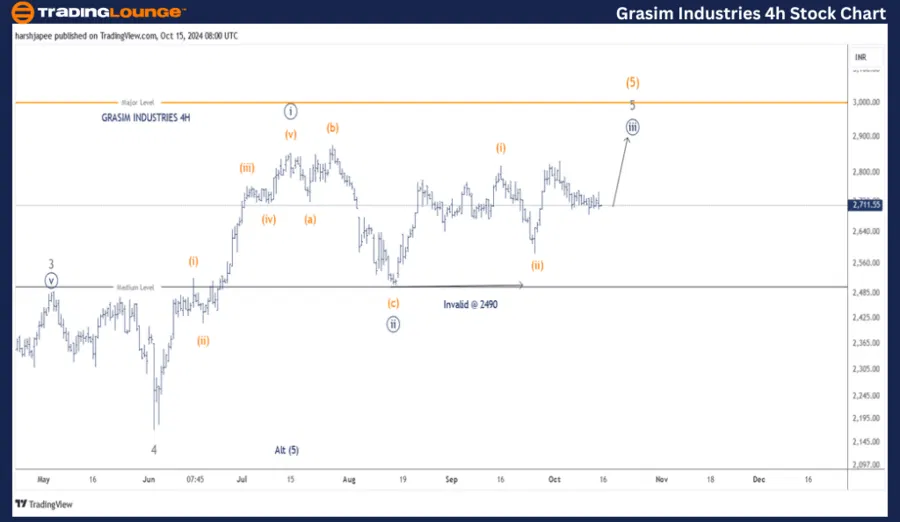
Grasim Industries four-hour chart technical analysis and potential Elliott Wave counts
Grasim Industries 4H chart is highlighting the Minuette waves within Minute Waves ((i)) and ((ii)) Navy. The former was an impulse followed by an expanded flat 3-3-5 Minute Wave ((ii)) terminating around 2490 mark. Minute Wave ((iii)) is now progressing higher against 2490.
Conclusion
Grasim Industries is progressing higher within Minute Wave ((iii)) of Minor Wave 5 of Intermediate Wave (5) Orange against 2490.
Grasim Industries Elliott Wave technical analysis [Video]
Author

Peter Mathers
TradingLounge
Peter Mathers started actively trading in 1982. He began his career at Hoei and Shoin, a Japanese futures trading company.


![Hyperliquid representatives, Trade[XYZ] meet SEC Crypto Task Force to discuss digital asset regulation](https://editorial.fxsstatic.com/images/i/Hyperliquid_Bull.png)


