|

Gold Technical Analysis: Trapped in a sideways channel

  • Gold is moving in a sideways channel on the daily chart. 
  • The odds are stacked in favor of range breakdown. 

Gold is trading in a sideways manner around $1,461 per Oz in Asia. 

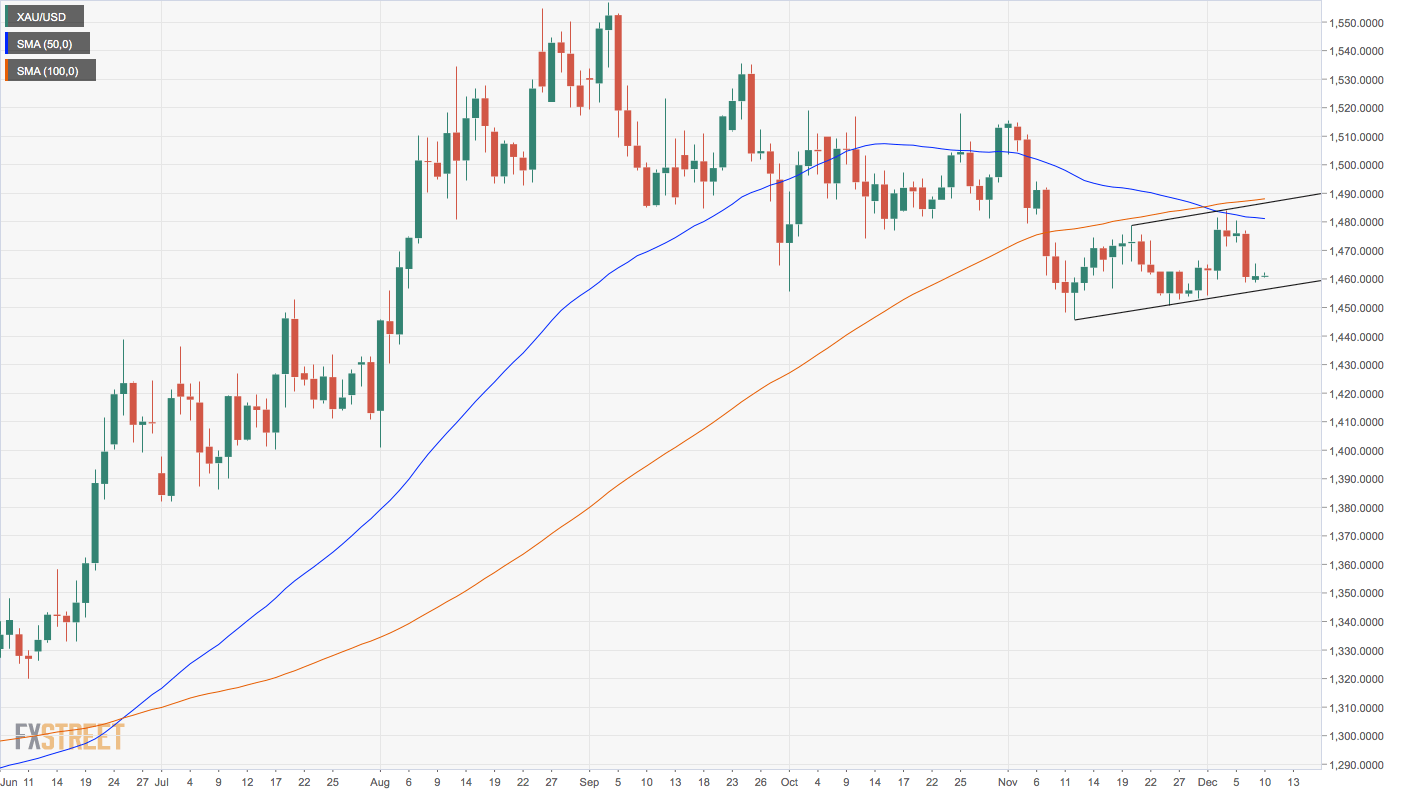
The yellow metal is trapped in a sideways channel, represented by trendlines connecting Nov. 12 and Nov. 26 lows and Nov. 20 and Dec. 4 highs. 

A channel breakdown, if confirmed, would imply a resumption of the sell-off from highs above $1,500 and open the doors for the 200-day average at $1,406. At press time, the lower edge the channel is seen at $1,454.

A range breakdown looks likely, as the odds are stacked in favor of the bears. For instance, the 50- and 100-day moving averages. 

Also, markets have priced out prospects of a Federal Reserve rate cut in 2020. A range breakdown, however, would remain elusive if the planned US tariff hike on $160 billion of Chinese imports takes effect Sunday. That will likely boost haven demand for gold. 

Daily chart

Trend: Neutral-to-bearish

Technical levels

XAU/USD

Overview
Today last price1461.2
Today Daily Change0.20
Today Daily Change %0.01
Today daily open1461
 
Trends
Daily SMA201465.51
Daily SMA501481.5
Daily SMA1001487.66
Daily SMA2001405.88
 
Levels
Previous Daily High1465.4
Previous Daily Low1458.82
Previous Weekly High1484.06
Previous Weekly Low1454.05
Previous Monthly High1515.38
Previous Monthly Low1445.8
Daily Fibonacci 38.2%1462.88
Daily Fibonacci 61.8%1461.33
Daily Pivot Point S11458.08
Daily Pivot Point S21455.15
Daily Pivot Point S31451.49
Daily Pivot Point R11464.66
Daily Pivot Point R21468.32
Daily Pivot Point R31471.25

Author

Omkar Godbole

Omkar Godbole

FXStreet Contributor

Omkar Godbole, editor and analyst, joined FXStreet after four years as a research analyst at several Indian brokerage companies.

More from Omkar Godbole
Share:

Editor's Picks

EUR/USD trims gains, hovers around 1.1900 post-US data

EUR/USD trades slightly on the back foot around the 1.1900 region in a context dominated by the resurgence of some buying interest around the US Dollar on turnaround Tuesday. Looking at the US docket, Retail Sales disappointed expectations in December, while the ADP 4-Week Average came in at 6.5K.

GBP/USD comes under pressure near 1.3680

The better tone in the Greenback hurts the risk-linked complex on Tuesday, prompting GBP/USD to set aside two consecutive days of gains and trade slightly on the defensive below the 1.3700 mark. Investors, in the meantime, keep their attention on key UK data due later in the week.

Gold loses some traction, still above $5,000

Gold faces some selling pressure on Tuesday, surrendering part of its recent two-day advance although managing to keep the trade above the $5,000 mark per troy ounce. The daily pullback in the precious metal comes in response to the modest rebound in the US Dollar, while declining US Treasury yields across the curve seem to limit the downside.

XRP holds $1.40 amid ETF inflows and stable derivatives market

Ripple trades under pressure, with immediate support at $1.40 holding at the time of writing on Tuesday. A recovery attempt from last week’s sell-off to $1.12 stalled at $1.54 on Friday, leading to limited price action between the current support and the resistance.

Dollar drops and stocks rally: The week of reckoning for US economic data

Following a sizeable move lower in US technology Stocks last week, we have witnessed a meaningful recovery unfold. The USD Index is in a concerning position; the monthly price continues to hold the south channel support.

XRP holds $1.40 amid ETF inflows and stable derivatives market

Ripple trades under pressure, with immediate support at $1.40 holding at the time of writing on Tuesday. A recovery attempt from last week’s sell-off to $1.12 stalled at $1.54 on Friday, leading to limited price action between the current support and the resistance.