Gold Technical Analysis: Gold bulls optimistic above the 200-day simple moving average - $1,230.00/oz bear target

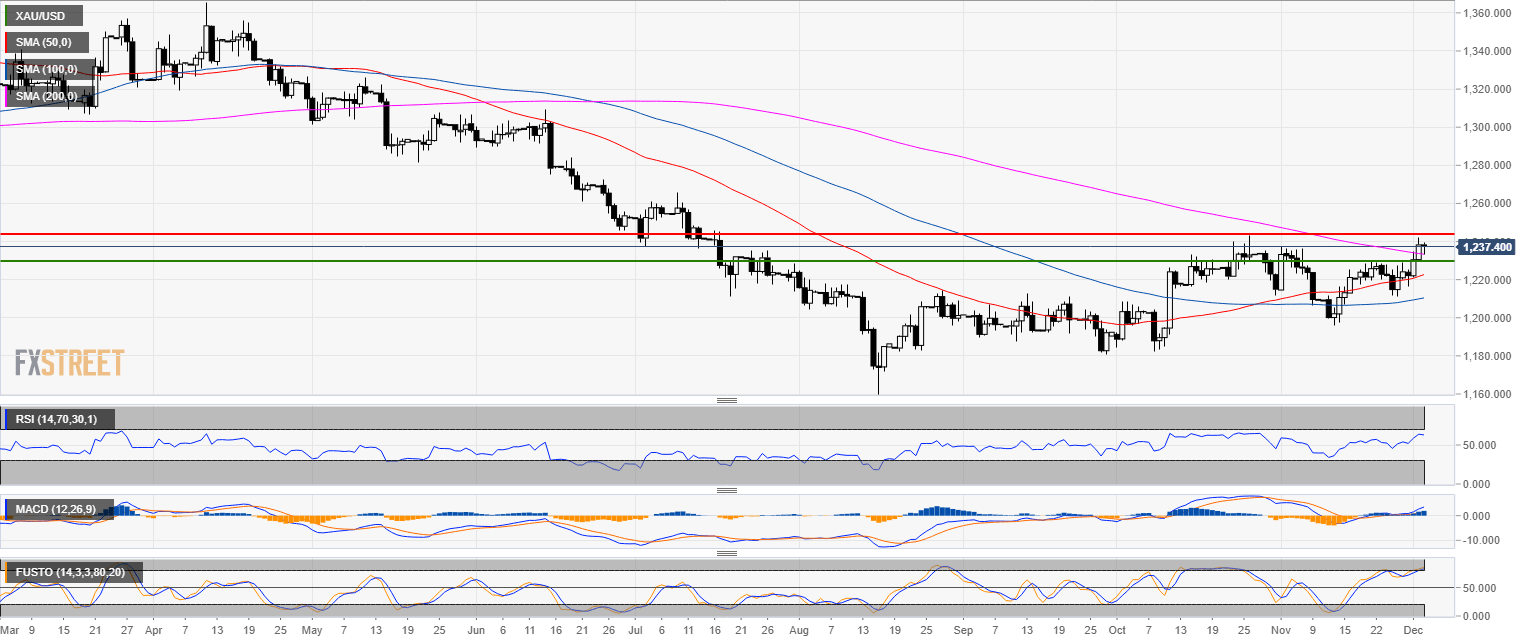
Gold daily chart
- Gold broke above the 200-day simple moving average (SMA) which is considered bullish.
- Technical indicators are bullish.
- Wednesday is an inside day.
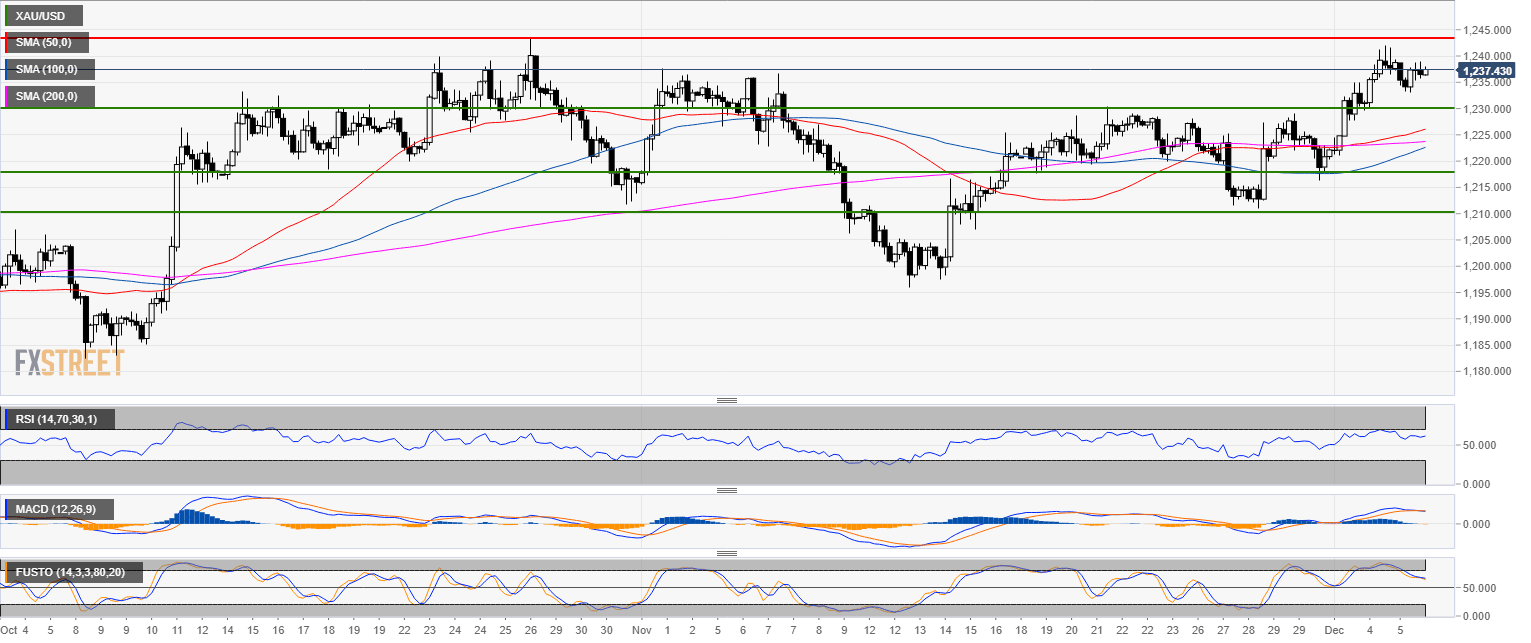
Gold 4-hour chart
- Gold is trading above its main SMAs.
- 1,244.00 is the strong resistance to overcome for further bullish advances.
- Failure to do so would lead to a pullback to 1,230.00 in the coming sessions.
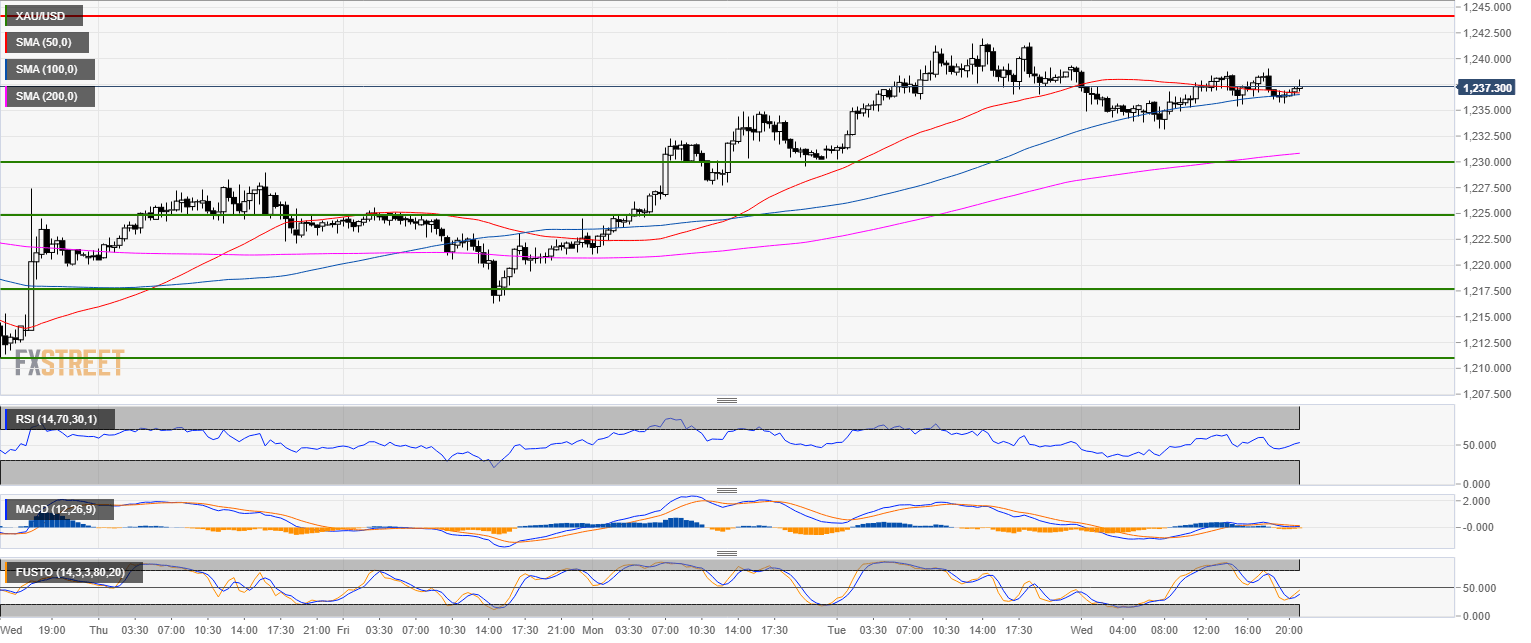
Gold 30-minute chart
- Gold pulled back to the 50 and 100 SMA as the market is decelerating.
- While there might be a spike to 1,244.00, it is more likely that the market will correct to 1.230.00
- The correction to 1,230.00 might take place even after a potential spike up to 1,244.00.
Additional key levels
XAU/USD
Overview:
Today Last Price: 1237.74
Today Daily change: -37 pips
Today Daily change %: -0.0299%
Today Daily Open: 1238.11
Trends:
Previous Daily SMA20: 1218.99
Previous Daily SMA50: 1221.7
Previous Daily SMA100: 1209.9
Previous Daily SMA200: 1233.72
Levels:
Previous Daily High: 1241.9
Previous Daily Low: 1230.6
Previous Weekly High: 1231.8
Previous Weekly Low: 1211.2
Previous Monthly High: 1237.4
Previous Monthly Low: 1196.4
Previous Daily Fibonacci 38.2%: 1237.58
Previous Daily Fibonacci 61.8%: 1234.91
Previous Daily Pivot Point S1: 1231.84
Previous Daily Pivot Point S2: 1225.56
Previous Daily Pivot Point S3: 1220.53
Previous Daily Pivot Point R1: 1243.14
Previous Daily Pivot Point R2: 1248.17
Previous Daily Pivot Point R3: 1254.45
Author

Flavio Tosti
Independent Analyst


