Gold holds above $5,000 amid escalating US-Iran tensions, firm PCE
- Gold trades above $5,000 on Friday as escalating US-Iran tensions lift safe-haven demand.
- Market digest US economic data, including core PCE inflation and US GDP.
- Bulls hold above the 100-SMA on the 4-hour chart, but any upside looks capped near the $5,050-$5,100 resistance area.
Gold (XAU/USD) gains momentum on Friday after trading largely flat on the previous day, as ongoing tensions between the United States (US) and Iran lift demand for safe-haven assets. Meanwhile, hotter-than-expected US Personal Consumption Expenditures (PCE) inflation data adds to concerns about persistent price pressure, reinforcing Gold’s appeal as a hedge against inflation.
At the time of writing, XAU/USD is trading near $5,030, extending its recovery after sliding to a nearly two-week low around $4,842 on Tuesday.
US-Iran tensions intensify amid military buildup
US-Iran tensions escalated after US President Donald Trump warned on Thursday that he expects clarity on a new nuclear deal within the next 10 to 15 days. “We’re either going to get a deal, or it’s going to be unfortunate for them,” Trump said, as the US military buildup in the Middle East continues.
Meanwhile, Iran and Russia also conducted joint naval drills in the Gulf of Oman on Thursday. Iran’s envoy to the United Nations said Tehran would respond “decisively” to any “military aggression” by the United States and called on the UN Security Council to condemn recent threats by President Trump.
Bullion has now retraced almost all of losses seen earlier in the week, suggesting buyers have stepped back in, reinforcing the broader bullish structure, even as a firm US Dollar (USD) and fading Federal Reserve (Fed) interest rate cut bets act as headwinds.
US core PCE inflation, GDP and consumer sentiment data
Resilient US economic data and hawkish-leaning Federal Reserve Meeting Minutes released earlier this week have prompted traders to scale back expectations for near-term interest-rate cuts. Even so, markets still anticipate that the Fed could lower borrowing costs twice this year.
The latest core PCE data further reinforced the view that the Fed may keep interest rates on hold in the coming months. Core PCE advanced 0.4% MoM in December, picking up from 0.2% and beating the 0.3% estimate, while the annual rate accelerated to 3.0% from 2.8%.
Surprisingly, the advance estimate of US Q4 GDP came in much weaker than expected. The US economy expanded at an annualized pace of 1.4% in Q4 2025, sharply down from a strong 4.4% growth rate in Q3 and well below market expectations of 3.0%.
The University of Michigan survey indicated soft consumer confidence in February. The headline Consumer Sentiment Index came in at 56.6, down from 57.3 previously, while the Expectations Index held steady at 56.6. Notably, inflation expectations ticked lower, with the 1-year outlook easing to 3.4% from 3.5% and the 5-year measure slipping to 3.3% from 3.4%.
Technical analysis: Bulls eye break above $5,050-$5,100 as momentum improves
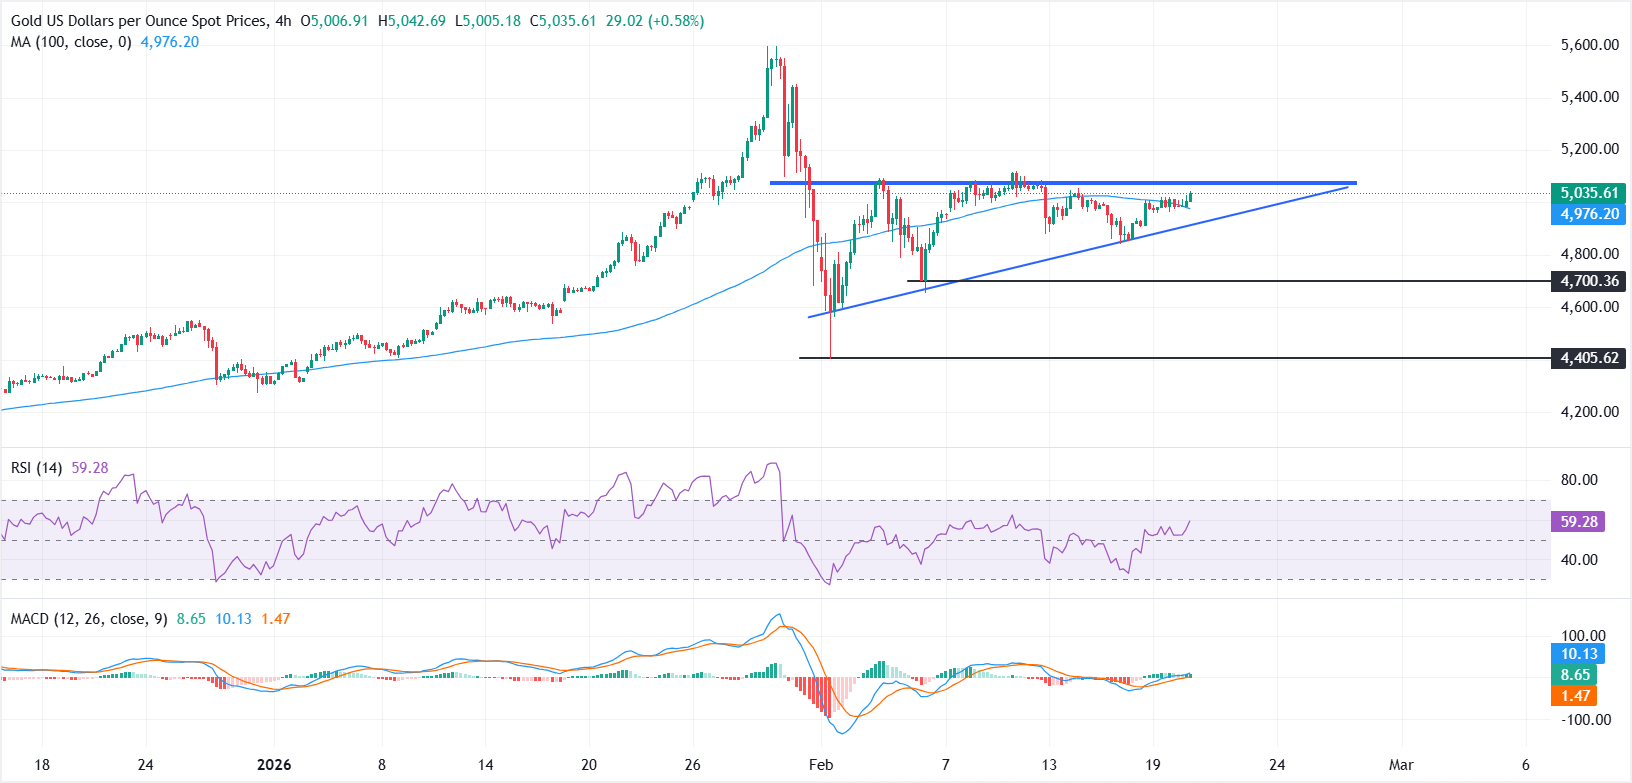
According to the 4-hour chart, the near-term structure remains neutral to mildly bullish. Prices are showing signs of stabilization above the 100-period Simple Moving Average (SMA) near $4,976.
On the upside, the $5,050-$5,100 region, which aligns with the upper boundary of the symmetrical triangle pattern, remains a key hurdle for bulls after facing repeated rejections.
A sustained move above this zone could strengthen bullish momentum and open the door for a broader extension of the recovery.
On the downside, a break back below the 100-period SMA could expose the rising trendline support of the symmetrical triangle pattern near $4,850. Further weakness may bring $4,700 into focus, followed by the $4,400 region.
Momentum indicators support the constructive bias. The Moving Average Convergence Divergence (MACD) line remains above the signal line in positive territory, with a widening histogram pointing to strengthening upside momentum.
Meanwhile, the Relative Strength Index (RSI) is hovering around 59, above the midline and pointing upwards, indicating improving tone without overbought conditions.
Gold FAQs
Gold has played a key role in human’s history as it has been widely used as a store of value and medium of exchange. Currently, apart from its shine and usage for jewelry, the precious metal is widely seen as a safe-haven asset, meaning that it is considered a good investment during turbulent times. Gold is also widely seen as a hedge against inflation and against depreciating currencies as it doesn’t rely on any specific issuer or government.
Central banks are the biggest Gold holders. In their aim to support their currencies in turbulent times, central banks tend to diversify their reserves and buy Gold to improve the perceived strength of the economy and the currency. High Gold reserves can be a source of trust for a country’s solvency. Central banks added 1,136 tonnes of Gold worth around $70 billion to their reserves in 2022, according to data from the World Gold Council. This is the highest yearly purchase since records began. Central banks from emerging economies such as China, India and Turkey are quickly increasing their Gold reserves.
Gold has an inverse correlation with the US Dollar and US Treasuries, which are both major reserve and safe-haven assets. When the Dollar depreciates, Gold tends to rise, enabling investors and central banks to diversify their assets in turbulent times. Gold is also inversely correlated with risk assets. A rally in the stock market tends to weaken Gold price, while sell-offs in riskier markets tend to favor the precious metal.
The price can move due to a wide range of factors. Geopolitical instability or fears of a deep recession can quickly make Gold price escalate due to its safe-haven status. As a yield-less asset, Gold tends to rise with lower interest rates, while higher cost of money usually weighs down on the yellow metal. Still, most moves depend on how the US Dollar (USD) behaves as the asset is priced in dollars (XAU/USD). A strong Dollar tends to keep the price of Gold controlled, whereas a weaker Dollar is likely to push Gold prices up.
Author

Vishal Chaturvedi
FXStreet
I am a macro-focused research analyst with over four years of experience covering forex and commodities market. I enjoy breaking down complex economic trends and turning them into clear, actionable insights that help traders stay ahead of the curve.


