Gold Technical Analysis: $1,244.00/oz is a brick wall - 1,233.00 bear target

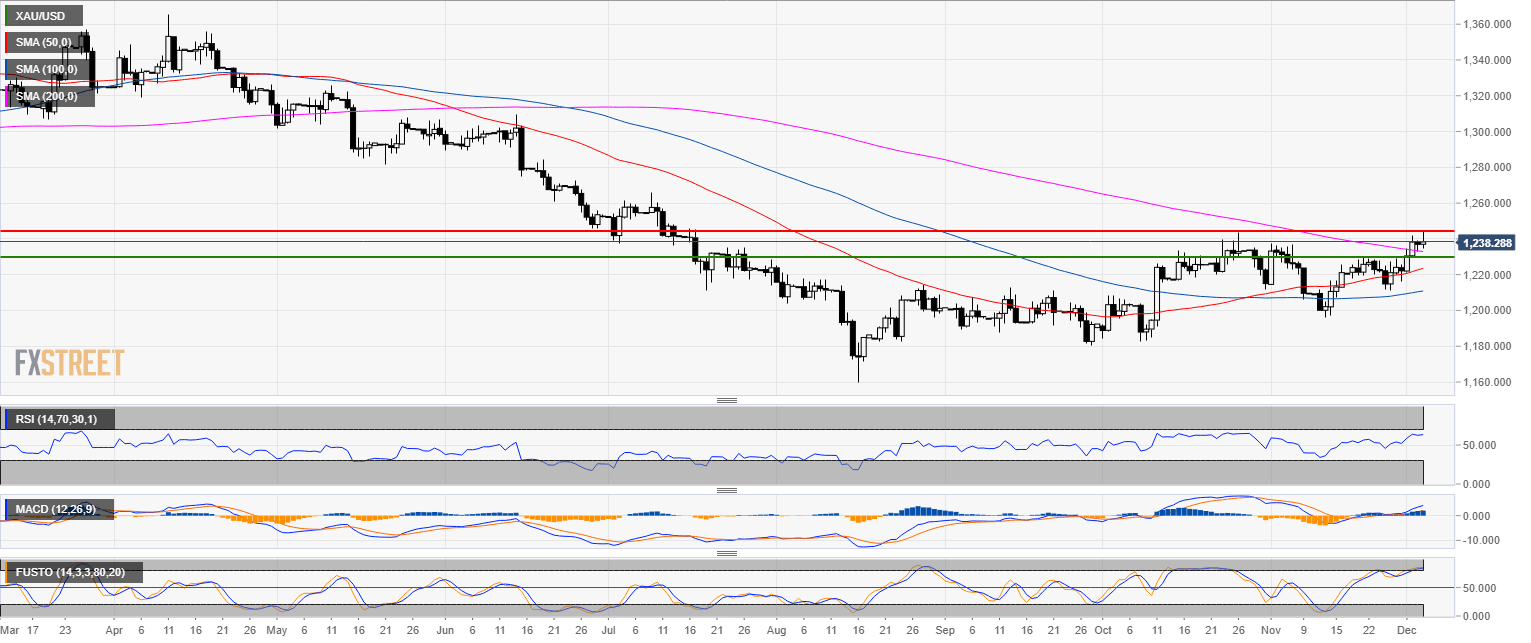
Gold daily chart
- Gold broke above the 200-day simple moving average (SMA) which is considered bullish. Technical indicators are bullish although the Stochastic is overbought.
- Thursday is a shooting star pattern, which is considered bearish.
- As forecast Gold found strong resistance at 1,244.00 resistance.
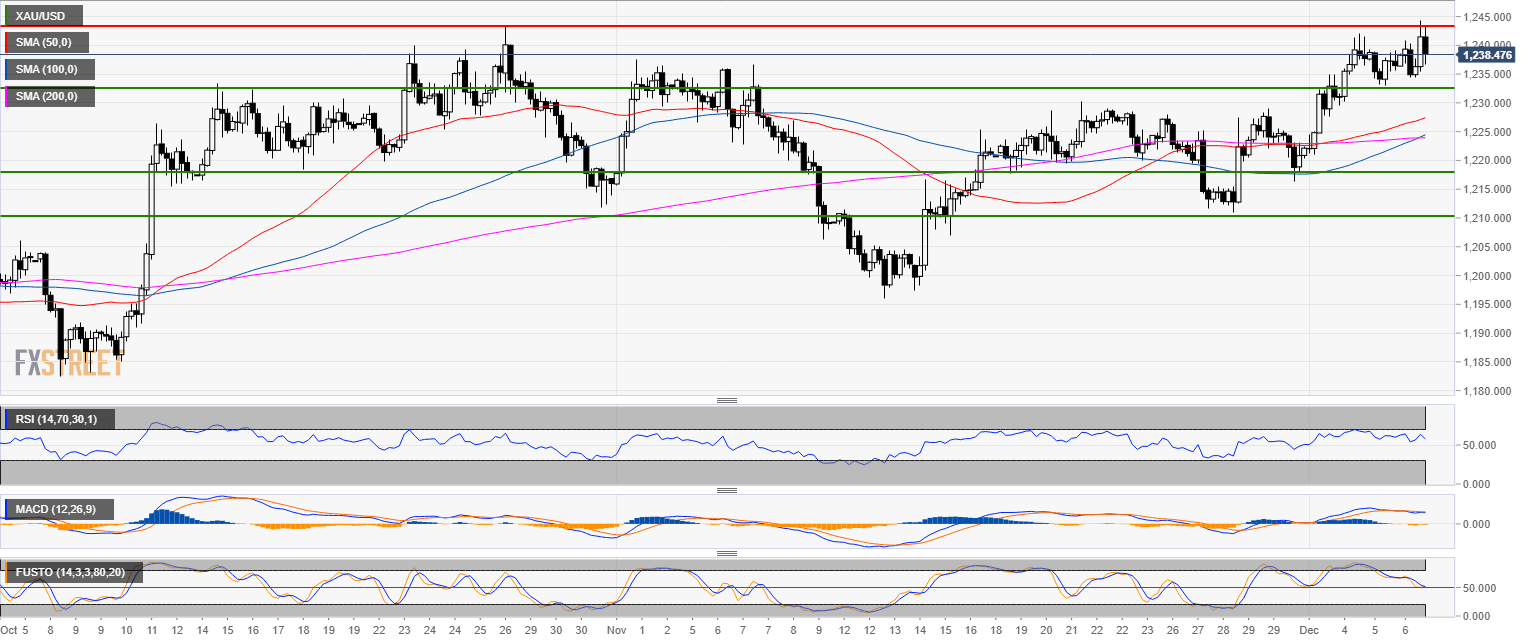
Gold 4-hour chart
- Now that the strong resistance at 1,244.00 is confirmed there is little in the way for the bears to drive the market to the 1,233.00 target.
Gold 30-minute chart
- The market is likely to slip through the 50 and 100 SMAs en route to the 200 SMA and 1,233.00.
- Technical indicators are bearish.

Additional key levels
XAU/USD
Overview:
Today Last Price: 1238.52
Today Daily change: 1.2e+2 pips
Today Daily change %: 0.0986%
Today Daily Open: 1237.3
Trends:
Previous Daily SMA20: 1220.4
Previous Daily SMA50: 1222.65
Previous Daily SMA100: 1210.42
Previous Daily SMA200: 1233.32
Levels:
Previous Daily High: 1239.36
Previous Daily Low: 1233.5
Previous Weekly High: 1231.8
Previous Weekly Low: 1211.2
Previous Monthly High: 1237.4
Previous Monthly Low: 1196.4
Previous Daily Fibonacci 38.2%: 1235.74
Previous Daily Fibonacci 61.8%: 1237.12
Previous Daily Pivot Point S1: 1234.08
Previous Daily Pivot Point S2: 1230.86
Previous Daily Pivot Point S3: 1228.23
Previous Daily Pivot Point R1: 1239.94
Previous Daily Pivot Point R2: 1242.57
Previous Daily Pivot Point R3: 1245.79
Author

Flavio Tosti
Independent Analyst


