Gold prices edge lower ahead of the Fed rate decision
- Gold prices are poised to face a key inflection point with the upcoming Fed rate decision and FOMC meeting in focus.
- Bullion’s safe-haven appeal continues to be influenced by Israel-Iran hostilities.
- XAU/USD pullback as the US Dollar rebounds.

Gold prices are edging lower against the US Dollar (USD) on Tuesday as traders digest mixed US Retail Sales data and monitor escalating tensions in the Middle East.
At the time of writing, XAU/USD is trading around $3,376, with traders shifting focus to Wednesday’s Federal Reserve (Fed) rate decision and accompanying Press Conference.
US Retail Sales data for May showed a 0.9% drop in headline sales on Tuesday, exceeding expectations, while sales excluding autos fell 0.3%. However, the GDP-related control group rose 0.4%, indicating a firm underlying level of consumption.
For the Federal Reserve (Fed), the data complicates the policy outlook. While weaker headline figures strengthen the case for future rate cuts, the firm control group reflects resilience, potentially delaying any monetary easing.
Meanwhile, geopolitical risks continue to support Gold prices. According to the World Gold Council’s (WGC) ‘2025 Central Bank Gold Reserves’ (CBGR) survey, published on Tuesday, central banks have added over 1,000 tonnes of gold annually for the past three years—more than double the 400 to 500 tonne average seen over the previous decade.
The World Gold Council (WGC) emphasized that the recent increase in gold accumulation has occurred during a time of rising geopolitical tensions and economic uncertainty.
This trend underscores a growing belief in Gold's reliability as a store of value, which will likely continue to support XAU/USD.
Daily digest market movers: Factors to watch for Gold
- The Israel–Iran conflict remains a key upside risk to global inflation, particularly through its potential impact on Oil supply and shipping routes. A sharp escalation could drive energy prices higher, stall progress in disinflation, and force central banks to keep interest rates elevated for longer. This scenario could harm Gold, as it faces competing forces of inflation hedging and higher US yields.
- With reports of fresh missile and drone strikes escalating fears of a broader regional war. Concerns over the security of the Strait of Hormuz—a key global oil transit route are further fueling demand for safe-haven assets, such as Gold, as traders brace for potential market disruptions.
- The US President Donald Trump stated in a post on Truth Social on Tuesday: "I have not reached out to Iran for ‘Peace Talks’ in any way, shape, or form. This is just more HIGHLY FABRICATED, FAKE NEWS! If they want to talk, they know how to reach me." He added that Iran “should have taken the deal that was on the table — would have saved a lot of lives.”
- Markets reacted after Trump had earlier called for Iranian citizens to evacuate Tehran, warning of further strikes. Israeli Prime Minister Benjamin Netanyahu echoed the message as Israeli airstrikes continued targeting Iranian nuclear and military sites. On Tuesday, Iran’s Revolutionary Guards confirmed new missile and drone attacks on Israeli positions. The growing risk of a full-blown regional war has sent XAU/USD climbing back toward $3,400.
- The focus on Wednesday will be on the Fed's Summary of Economic Projections (SEP) and the dot plot, which could reveal whether officials still anticipate one or two rate cuts in 2025 or scale back expectations in light of recent inflation risks.
Technical analysis: Gold bulls get rejected by resistance at $3,400
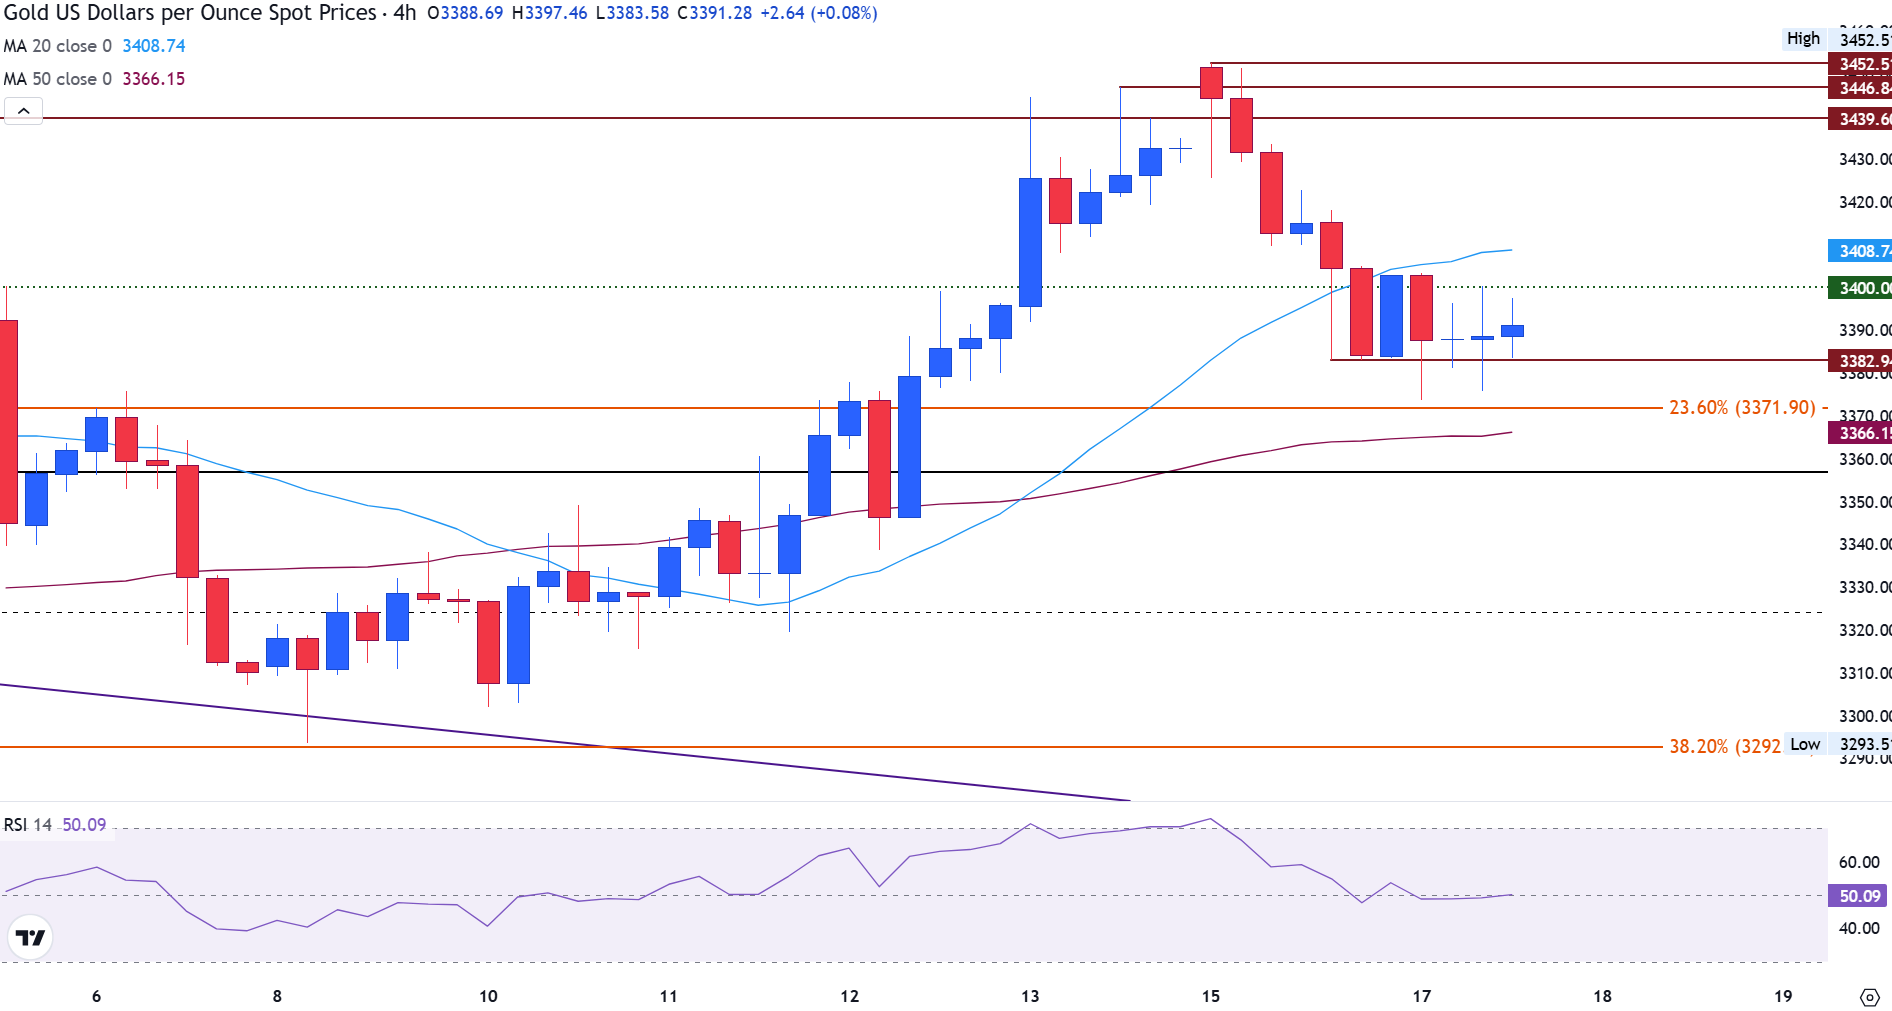
On the 4-hour chart, Gold (XAU/USD) is consolidating above the $3,375–$3,380 support zone, with prices last seen around $3,392.
The 20-period Simple Moving Average (SMA) at $3,408 is capping immediate upside, while the 23.6% Fibonacci retracement of the recent rally offers support at $3,371. Below that, the 50-period SMA at $3,365 reinforces key demand.
A break above $3,408 could lead to a retest of the monthly highs at $3,446 and $3,452. On the downside, failing to hold $3,371 could expose a deeper retracement toward $3,292, the 38.2% Fibonacci level. The Relative Strength Index (RSI) hovers near 50, indicating neutral momentum with room to extend in either direction.
Gold 4-hour chart
Dot Plot FAQs
The “Dot Plot” is the popular name of the interest-rate projections by the Federal Open Market Committee (FOMC) of the US Federal Reserve (Fed), which implements monetary policy. These are published in the Summary of Economic Projections, a report in which FOMC members also release their individual projections on economic growth, the unemployment rate and inflation for the current year and the next few ones. The document consists of a chart plotting interest-rate projections, with each FOMC member’s forecast represented by a dot. The Fed also adds a table summarizing the range of forecasts and the median for each indicator. This makes it easier for market participants to see how policymakers expect the US economy to perform in the near, medium and long term.
The US Federal Reserve publishes the “Dot Plot” once every other meeting, or in four of the eight yearly scheduled meetings. The Summary of Economic Projections report is published along with the monetary policy decision.
The “Dot Plot” gives a comprehensive insight into the expectations from Federal Reserve (Fed) policymakers. As projections reflect each official’s projection for interest rates at the end of each year, it is considered a key forward-looking indicator. By looking at the “Dot Plot” and comparing the data to current interest-rate levels, market participants can see where policymakers expect rates to head to and the overall direction of monetary policy. As projections are released quarterly, the “Dot Plot” is widely used as a guide to figure out the terminal rate and the possible timing of a policy pivot.
The most market-moving data in the “Dot Plot” is the projection of the federal funds rate. Any change compared with previous projections is likely to influence the US Dollar (USD) valuation. Generally, if the “Dot Plot” shows that policymakers expect higher interest rates in the near term, this tends to be bullish for USD. Likewise, if projections point to lower rates ahead, the USD is likely to weaken.
Author

Tammy Da Costa, CFTe®
FXStreet
Tammy is an economist and market analyst with a deep passion for financial markets, particularly commodities and geopolitics.


