Gold corrects back after reaching oversold levels
- Gold is pulling back after last week’s steep sell-off.
- Traders are keen to wait for US inflation data later this week to reassess fundamentals.
- Gold is probably forming a consolidation or continuation pattern within a downtrend that is likely to go lower.

Gold (XAU/USD) is trading in the $2,340s, making a modest pullback from oversold levels on Monday. Markets are quiet ahead of potentially market-moving US inflation data later in the week. Public holidays in the UK and the US further reduce volumes.
Gold pulls back after steep sell-off
Gold price dropped from a peak of $2,450 to a low of $2,325 last week, on the back of changing expectations for the future path of US interest rates.
Better-than-expected US economic data last week led to a revision of market expectations for when the US Federal Reserve (Fed) is foreseen lowering interest rates. Whilst last week interest-rate future’s markets gave a probability of 65% that the Fed will lower its fed funds rate by 0.25% at its September meeting, today they are only giving it odds of 49%, according to the CME Fedwatch tool.
The maintenance of interest rates at high levels is negative for non-yielding Gold because it increases the opportunity cost of holding the precious metal.
Technical Analysis: Gold consolidates in new downtrend
Gold price is consolidating after a steep decline. Last week’s sell-off took it below a major trendline and has ushered in a new more bearish technical environment.
Gold is probably in a short-term downtrend now, favoring short positions over longs.
XAU/USD 4-hour Chart
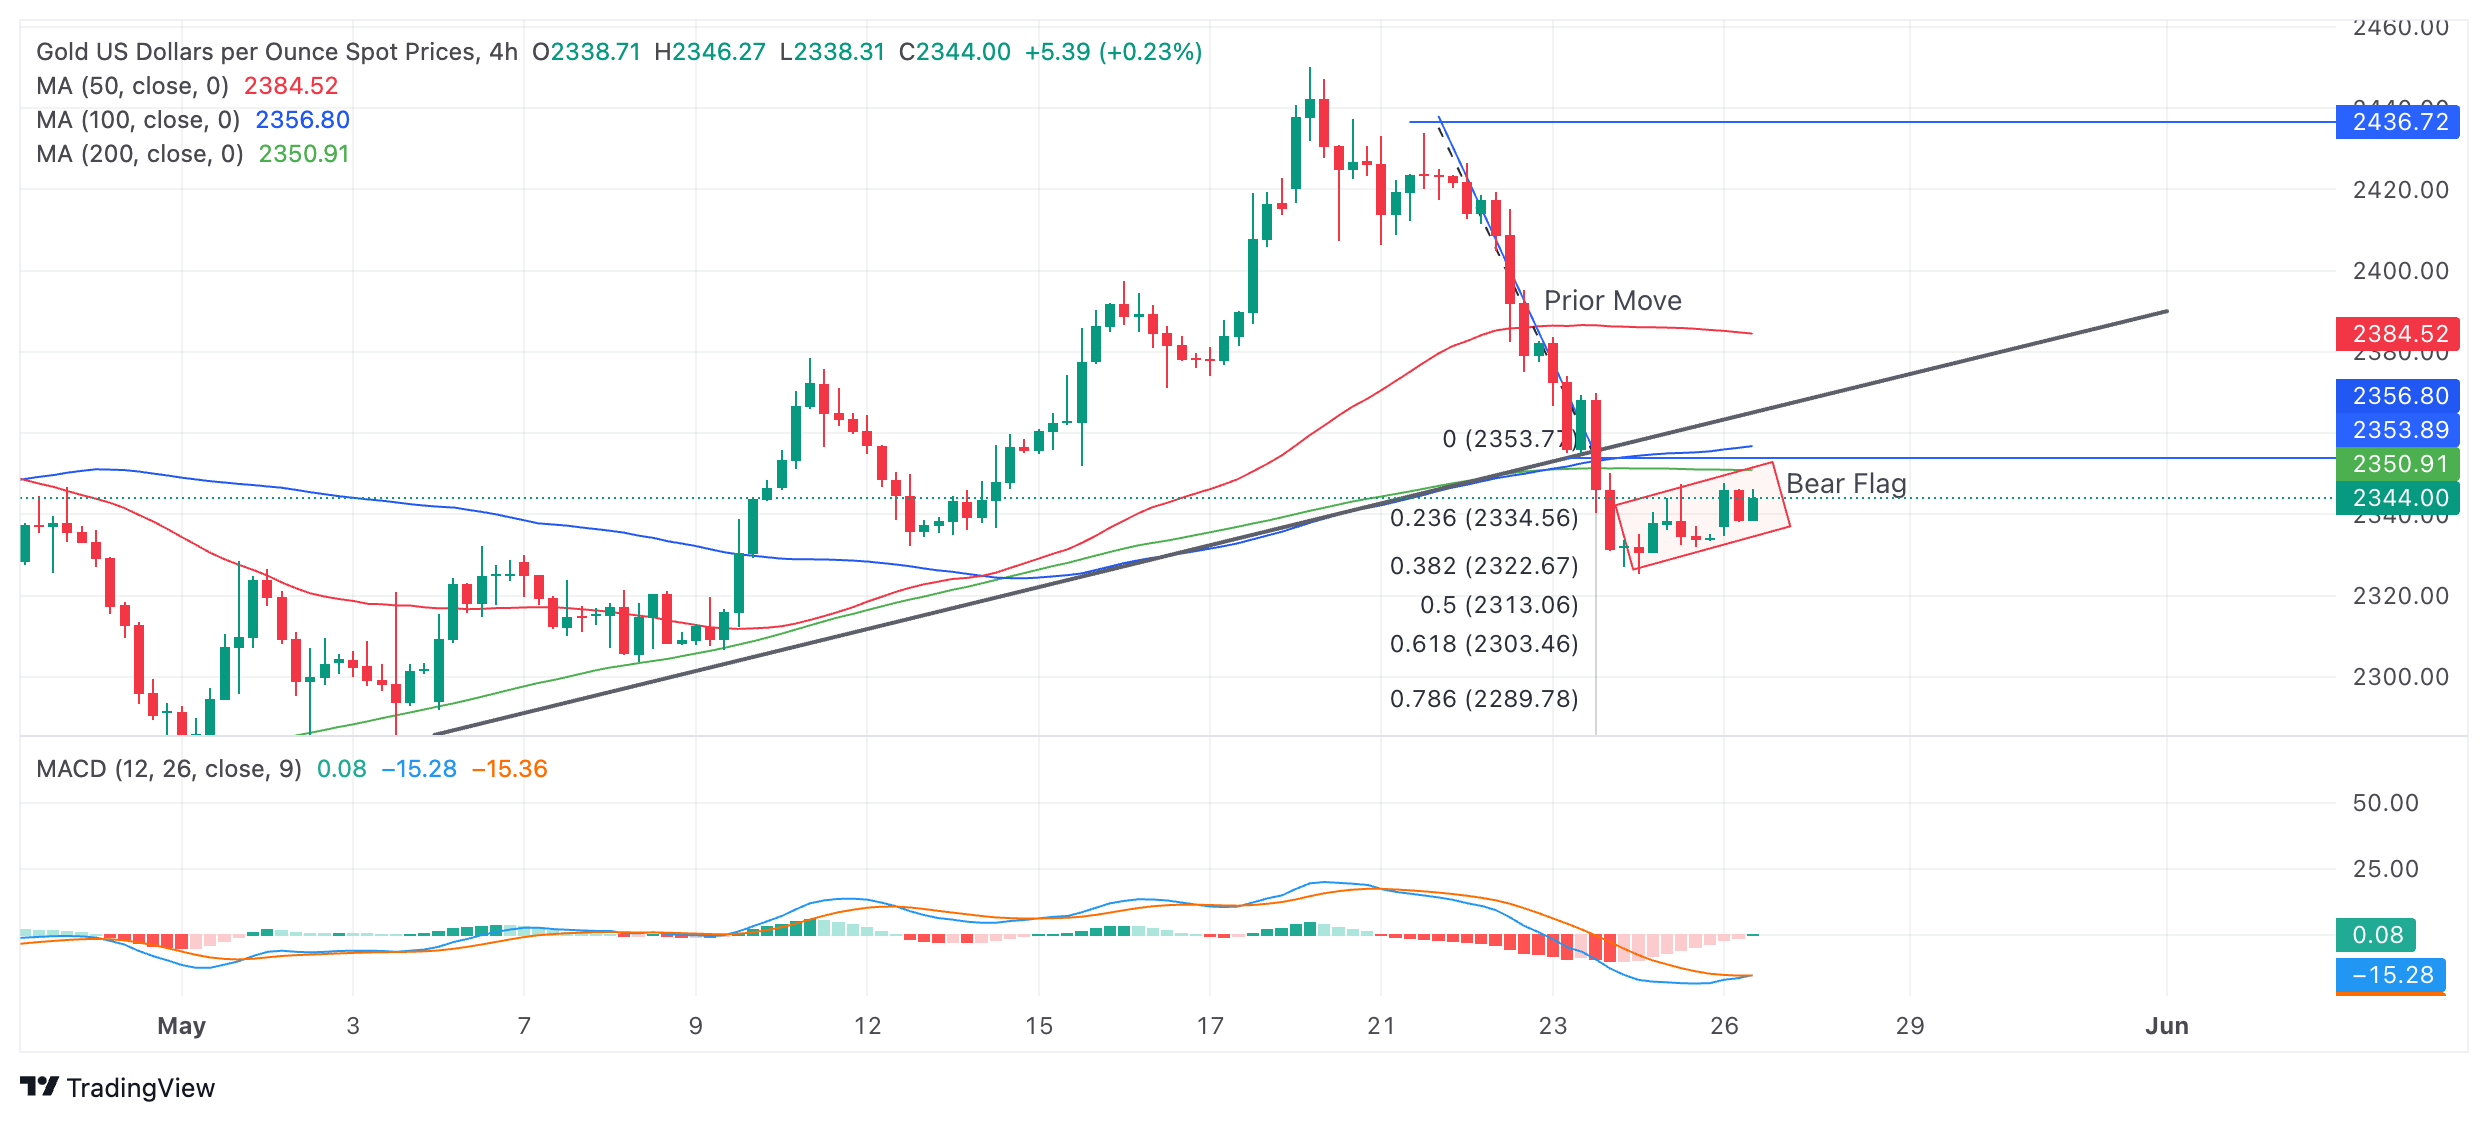
The precious metal is seen pulling back (red rectangle) on the 4-hour chart used to assess the short-term trend. The pullback is relatively shallow, however, and looks vulnerable to break down. The pullback might even be an evolving Bear Flag continuation price pattern. If so, it would suggest substantial downside – to at least $2,300 – in the event of a break below the $2,325 May 24 lows.
Last week’s decisive break of the major trendline indicates a likely follow-through lower. The conservative target for the follow-through is $2,303 (the Fibonacci 0.618 extrapolation of the down move prior to the break – from $2,435 to $2,355).
A more bearish move could see Gold fall all the way down to $2,272 (the 100% extrapolation of the move prior to the break). The latter level is also the support from the May 3 lower high. A break below the $2,325 lows would provide confirmation of more downside to these targets.
The Moving Average Convergence Divergence (MACD) indicator is attempting to cross above its signal line. If it is successful, it will give a buy signal and perhaps indicate the possibility the pullback is developing into a stronger upside correction
The precious metal’s medium and long-term trends are still bullish, further suggesting the risk of a recovery remains high, yet price action is not supporting a resumption hypothesis.
A decisive break back above the trendline at $2,360 would, however, provide evidence of a recovery and reversal of the short-term downtrend.
A decisive break would be one accompanied by a long green bullish candle or three green candles in a row.
(This story was corrected on May 27 at 13:30 GMT to say that the May 24 low is $2,325, not $3,325).
Interest rates FAQs
Interest rates are charged by financial institutions on loans to borrowers and are paid as interest to savers and depositors. They are influenced by base lending rates, which are set by central banks in response to changes in the economy. Central banks normally have a mandate to ensure price stability, which in most cases means targeting a core inflation rate of around 2%. If inflation falls below target the central bank may cut base lending rates, with a view to stimulating lending and boosting the economy. If inflation rises substantially above 2% it normally results in the central bank raising base lending rates in an attempt to lower inflation.
Higher interest rates generally help strengthen a country’s currency as they make it a more attractive place for global investors to park their money.
Higher interest rates overall weigh on the price of Gold because they increase the opportunity cost of holding Gold instead of investing in an interest-bearing asset or placing cash in the bank. If interest rates are high that usually pushes up the price of the US Dollar (USD), and since Gold is priced in Dollars, this has the effect of lowering the price of Gold.
The Fed funds rate is the overnight rate at which US banks lend to each other. It is the oft-quoted headline rate set by the Federal Reserve at its FOMC meetings. It is set as a range, for example 4.75%-5.00%, though the upper limit (in that case 5.00%) is the quoted figure. Market expectations for future Fed funds rate are tracked by the CME FedWatch tool, which shapes how many financial markets behave in anticipation of future Federal Reserve monetary policy decisions.
Author

Joaquin Monfort
FXStreet
Joaquin Monfort is a financial writer and analyst with over 10 years experience writing about financial markets and alt data. He holds a degree in Anthropology from London University and a Diploma in Technical analysis.