Gold Price News and Forecast: XAU/USD trades within a triangle

XAU/USD analysis: Tests 200-hour SMA
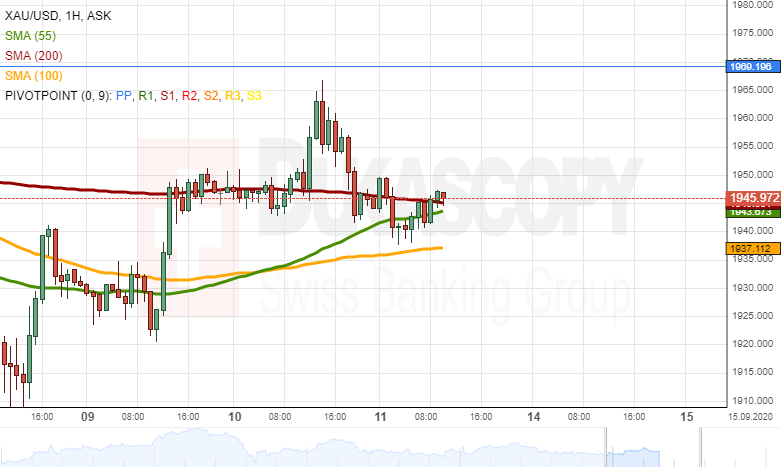
Yesterday, the XAU/USD exchange rate jumped to the 1,965.00 level. During Friday morning, the rate was testing the support provided by the 55-, 100– and 200-hour SMAs in the 1,940.00 area.
If the given support holds, it is likely that some upside potential could prevail, and the price for gold could target the monthly PP located at the 1,969.20 mark.
On the other hand, the yellow metal could trade sideways against the Greenback near the predetermined support in the short run. Read More...
Gold trades within a triangle
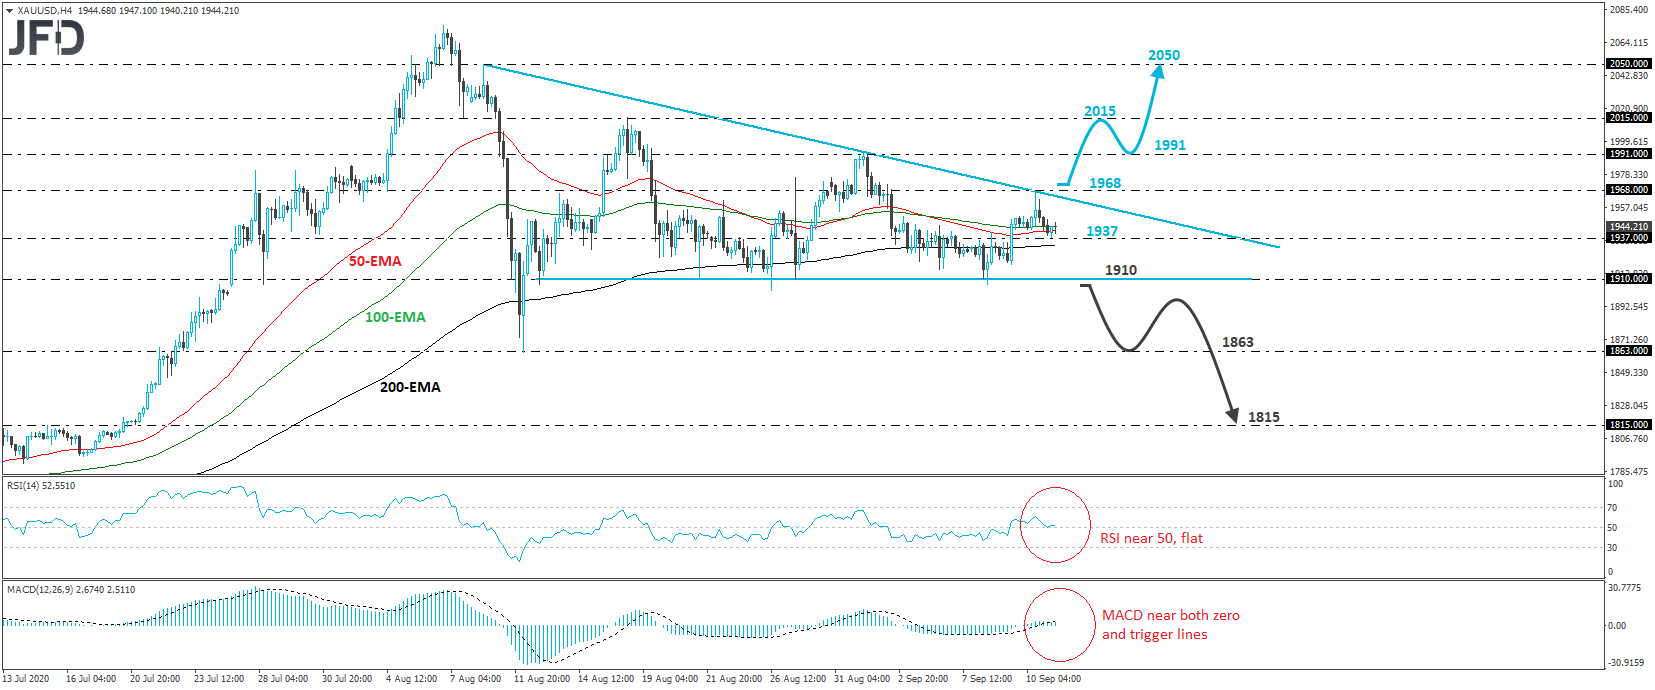
XAU/USD traded lower yesterday, after hitting resistance near the crossroads of the 1968 level and the downside resistance line drawn from the high of August 10th. That said, the slide was stopped today by the 1937 zone. Overall, the precious metal appears to be trading within a descending triangle, with the upper side being the aforementioned downside line and the lower bound being the 1910 hurdle. Although, in theory, most descending triangles are considered bearish, we’ve seen many of them followed by a bullish exit. Thus, we prefer to stay sidelined for now and to wait for the price to exit the pattern before we start examining the metal’s forthcoming direction.
A decisive break above 1968 would signal the upside exit out of the triangle and could also mean that the prevailing uptrend is back in force. The bulls may get encouraged to push the action towards the 1991 zone, marked by the high of September 1st, the break of which could pave the way towards the peak of August 18th, at around 2015. Read More...
Gold prepares for massive bullish trend but break needed
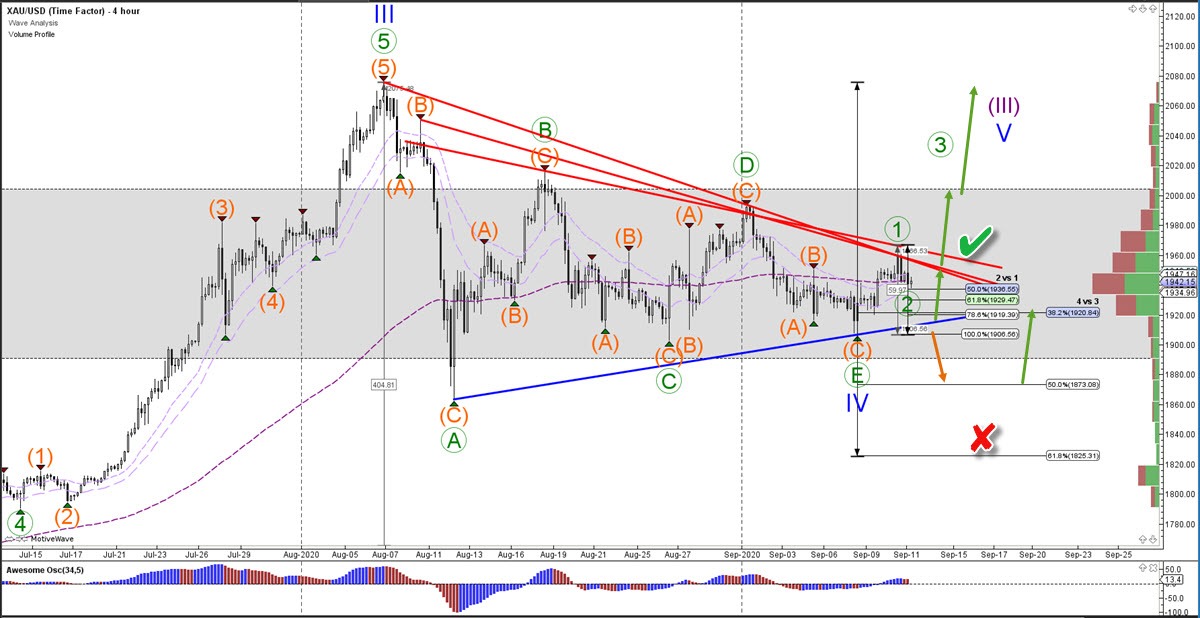
The XAU/USD (Gold) chart is showing the end of an ABCDE triangle pattern (green). This could complete a wave 4 (blue) retracement and restart the uptrend. What is the key breakout zone for the bulls?
Gold needs to make a bullish break above the resistance trend lines (red) to confirm the upside (green check). There is not much resistance ahead from a volume point of view once the breakout occurs. Although the tops of wave B and D remain sub levels to be aware of. The current wave 1-2 pattern remains valid as long as price stays above the Fib levels of 2 vs 1. A break below the 100% Fib could indicate a deeper retracement first within the larger uptrend. Read More...
Author

FXStreet Team
FXStreet


