Gold Price News and Forecast: XAU/USD jumps to highest since Nov. 9

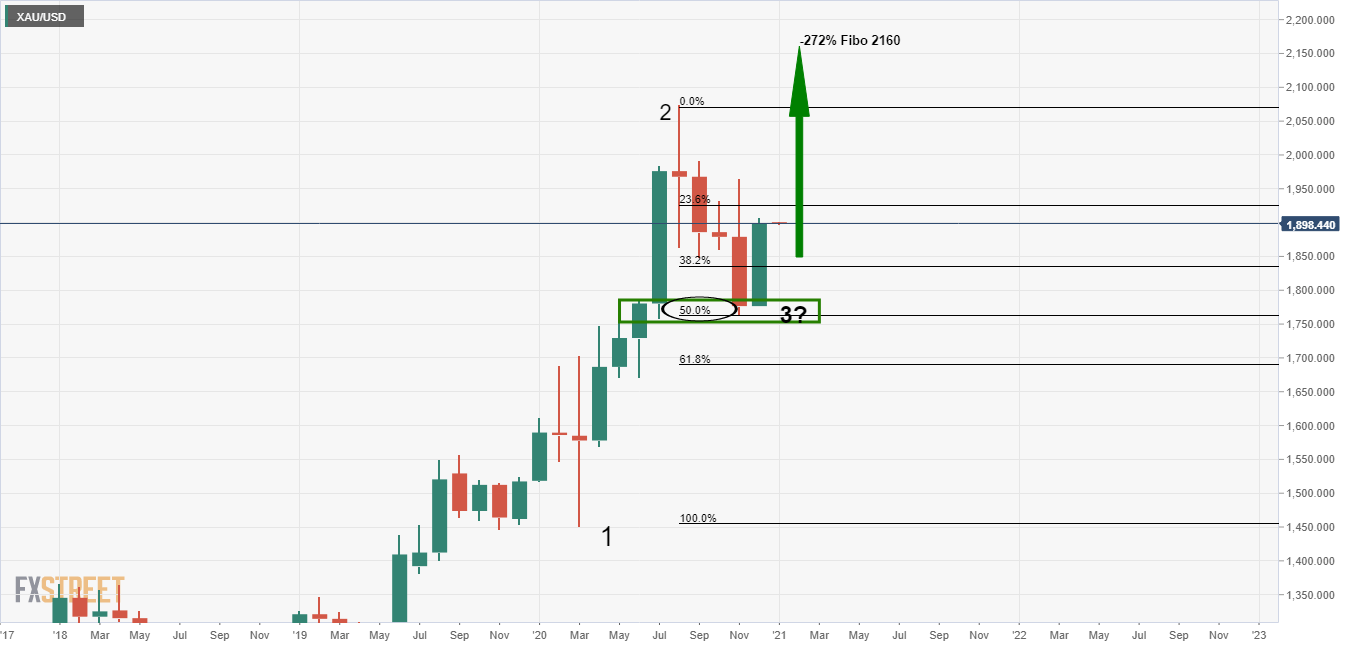
The Chart of the Week: Gold's technical alure with ebbs and flow between here and $2,160
Gold has carved out a bullish technical picture across the monthly, weekly and daily time frames and investors will take note of the monthly 50% mean reversion coupled with an increase in net long positions.
In the meanwhile, the weekly picture has a market testing a critical resistance zone while the daily chart could be in the throes of forming an overextended W-formation.
The following is a top-down analysis of the structure of the market which derives at a wait-and-see scenario from a daily perspective, monitoring what could be the makings of the next swing trading opportunity.
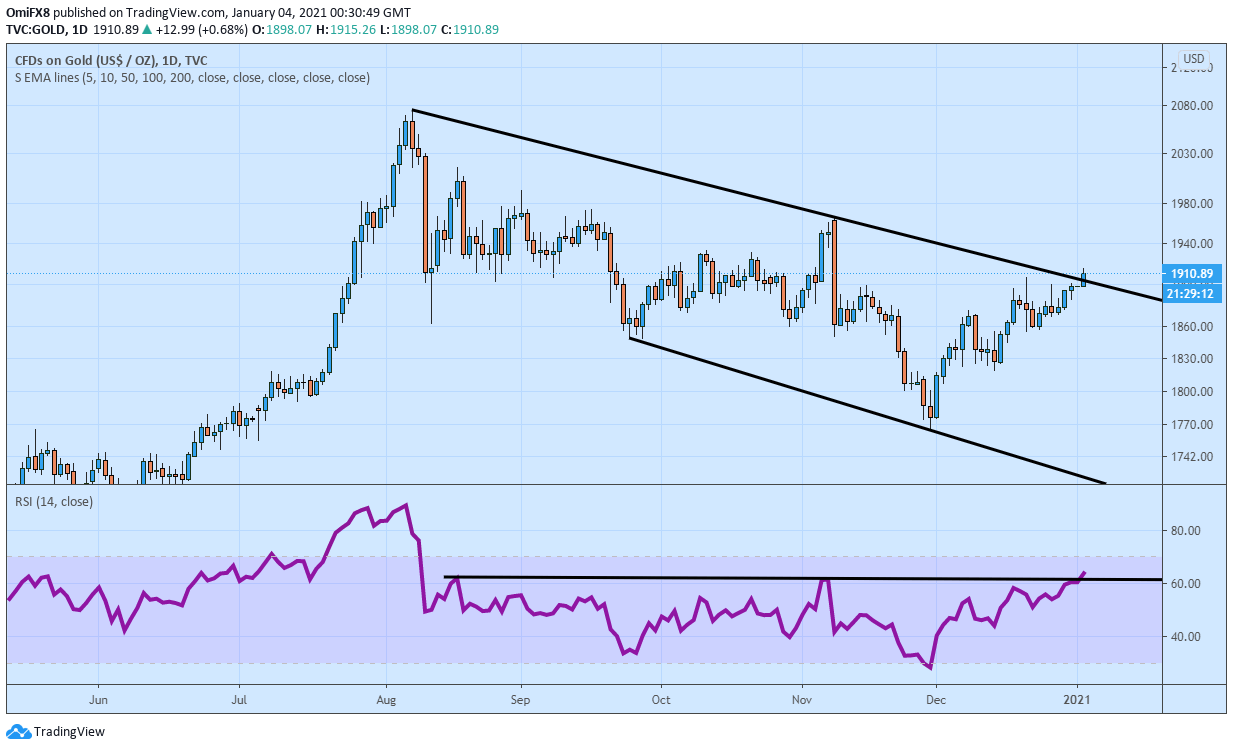
Gold Price Analysis: XAU/USD jumps to highest since Nov. 9
Gold is trading at $1,915 per ounce at press time. That's the highest level in nearly two months.
The daily chart shows the metal is breaking out of a five-month falling channel represented by trendlines connecting Aug. 7 and Nov. 9 highs and Sept. 24 and Nov. 30 lows.
Author
FXStreet Team
FXStreet
Composed of a group of economic journalists and FX experts, the FXStreet content team produces and oversees all content published on FXStreet. It provides a purely journalistic approach to the Forex market.


