The Chart of the Week: Gold's technical allure with ebbs and flow between here and $2,160
- Gold is firmly in the hands of the bulls across the spectrum of popular time frames.
- An overextended W-formation is on the cards for a downside opportunity before a test of critical daily resistance.

Gold has carved out a bullish technical picture across the monthly, weekly and daily time frames and investors will take note of the monthly 50% mean reversion coupled with an increase in net long positions.
In the meanwhile, the weekly picture has a market testing a critical resistance zone while the daily chart could be in the throes of forming an overextended W-formation.
The following is a top-down analysis of the structure of the market which derives at a wait-and-see scenario from a daily perspective, monitoring what could be the makings of the next swing trading opportunity.
Monthly chart
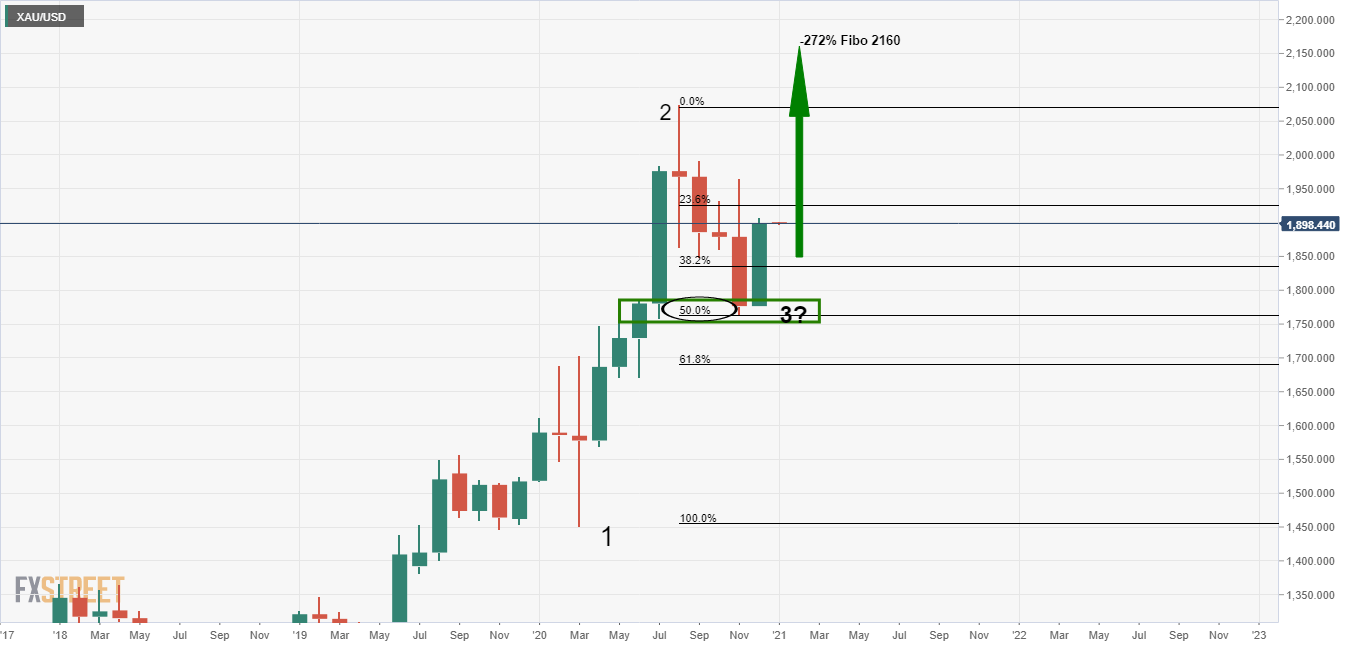
As illustrated, the correction of the monthly bullish impulse from down in the 1450 regions has completed to a 50% mean reversion level.
This is a significant enough correction to expect a fresh bullish impulse to develop in a continuation of the broader and longterm bullish trend.
By measuring the length of the correction from bottom to top, we can find a -272% Fibonacci level at 2160 for which investors will have on their radars for the long-term.
Weekly chart
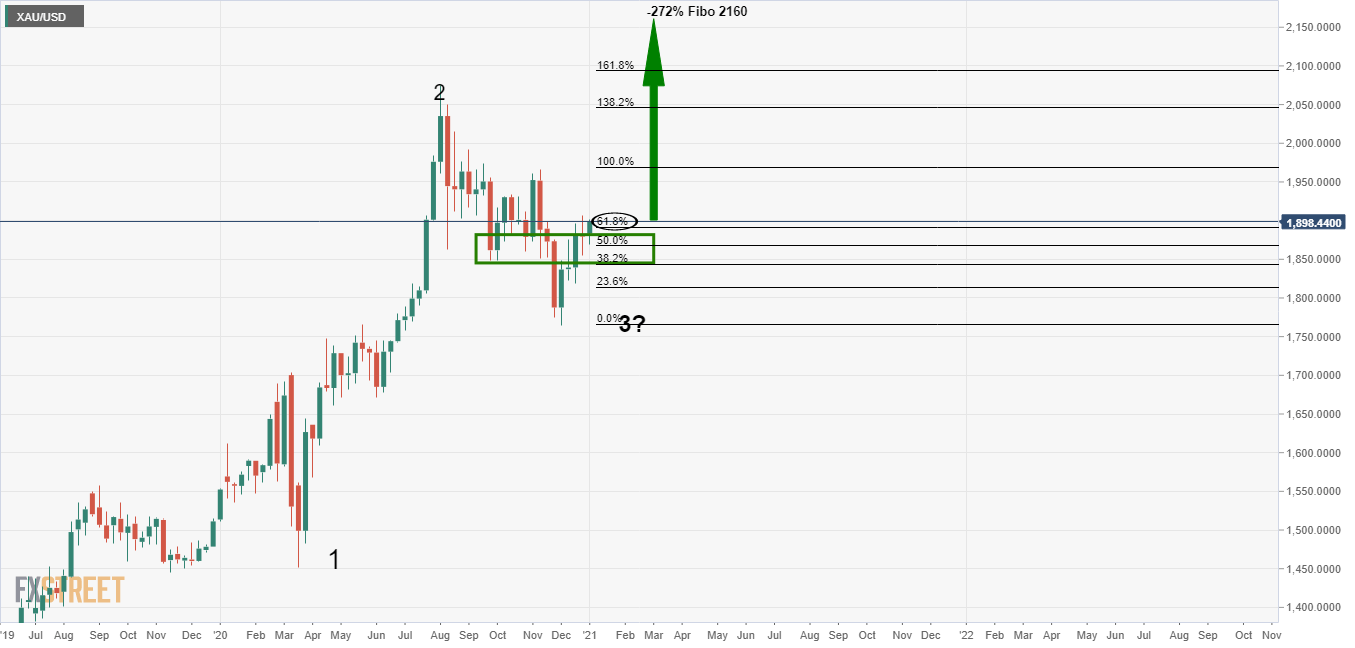
The weekly chart shows that the third wave has started to retrace the correction by as much as a 61.8% Fibonacci retracement. In doing so, it has penetrated the old resistance area that has now turned support.
While some consolidation could now be in order, there is an upside bias while holding above the old resistance tat has now turned support.
Daily chart
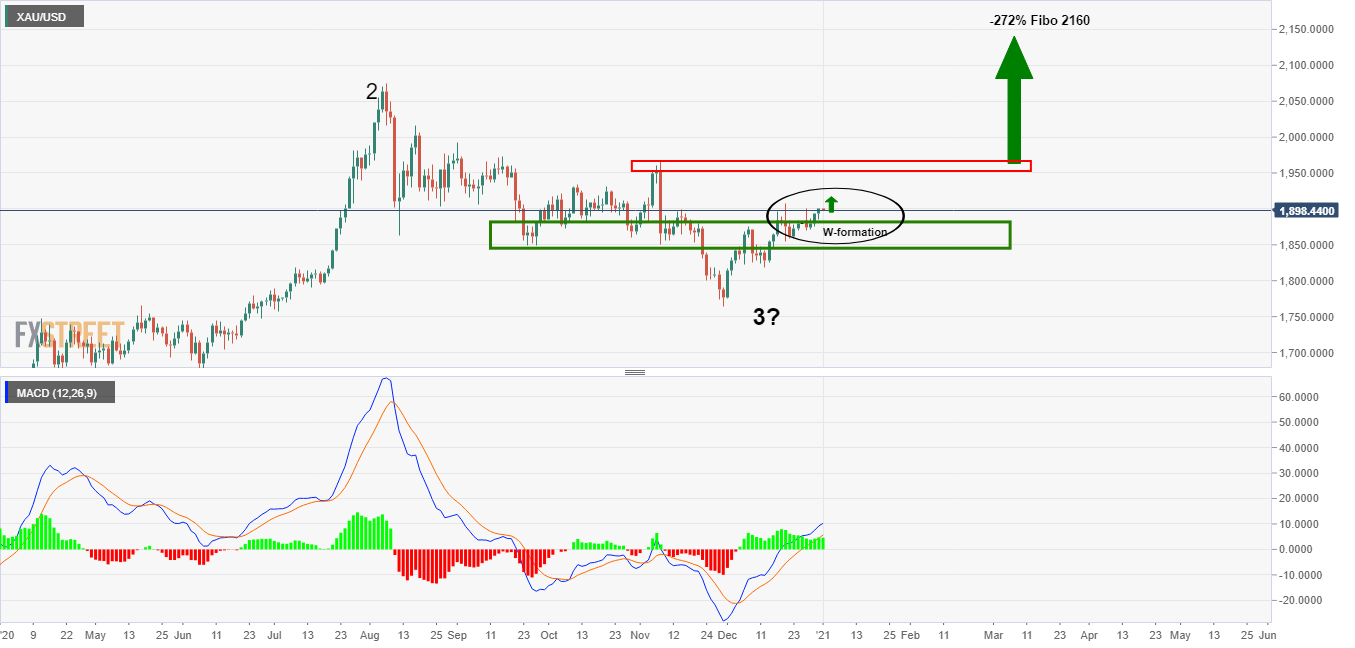
MACD shows that there is bullish momentum in the price on the daily chart.
If price continues higher, an extended W-formation will be on the cards. This is significant as that is where the next higher probability opportunity for swing traders could arise.
An overextended W-formation once topped out, would be expected to retrace to at least 38.2% Fibonacci level. Traders can enter short at an optimum level from a resistance structure on a lower time frame, such as the 4-hour chart, to target the downside.
Once the downside has completed, bulls will be coming back to the table and will have the overhead resistance, 1965, in their sights again.
A break of the overhead resistance will bring in the prospects of a meaningful spell through the psychological 2000 level where the longer-term target of 2160 will be in focus.
For now, it is a matter of seeing whether the current support holds and how far the bulls can run within this daily impulse before sellers emerge again.
Author

Ross J Burland
FXStreet
Ross J Burland, born in England, UK, is a sportsman at heart. He played Rugby and Judo for his county, Kent and the South East of England Rugby team.


