Gold Price Forecast: XAU/USD trades indecisively below $3,400, holds key 20-day EMA
- Gold price consolidates below $3,400 as investors await clarity on whether the US will strike Iran.
- The Fed held interest rates steady on Wednesday and raise interest rate target for next two years.
- Gold price remains well-supported by the 20-day EMA.

Gold price (XAU/USD) trades in a limited range below the round-level resistance of $3,400 during European trading hours on Thursday. The upside in the yellow metal appears to have been capped by upwardly revised interest rate target for 2026 and 2027 by the Federal Reserve (Fed) on Wednesday, following leaving them unchanged in the range of 4.25%-4.50% for the fourth straight meeting.
The Fed warned of increasing upside risks to inflation due to the imposition of tariff policy by Unted States (US) President Donald Trump raised inflation target for 2026 and 2027 to 3.6% and 3.4%, respectively.
Gold performs firmly in a high-inflation environment, however, higher interest rates by the Fed for a longer period bodes poorly for non-yielding assets.
On the downside, the yellow metal remains well-supported amid tensions escalating in the Middle East region.
Financial market participants have become concerned over the future of the Iran’s economy as the United States (US) considers striking Tehran, which is already battling a war with Israel.
According to a Bloomberg report, senior US officials are preparing for the possibility of a strike on Iran in the coming days. Earlier in the day, US President Donald Trump kept the scope of attacking Iranian nuclear facilities. “I may do it. I may not do it,” Trump said when asked whether he will launch airstrikes on Iranian nuclear facility earlier in the day, NBC News reported.
Theoretically, the demand for safe-haven assets, such as Gold, increases amid heightening geopolitical tensions.
Gold technical analysis
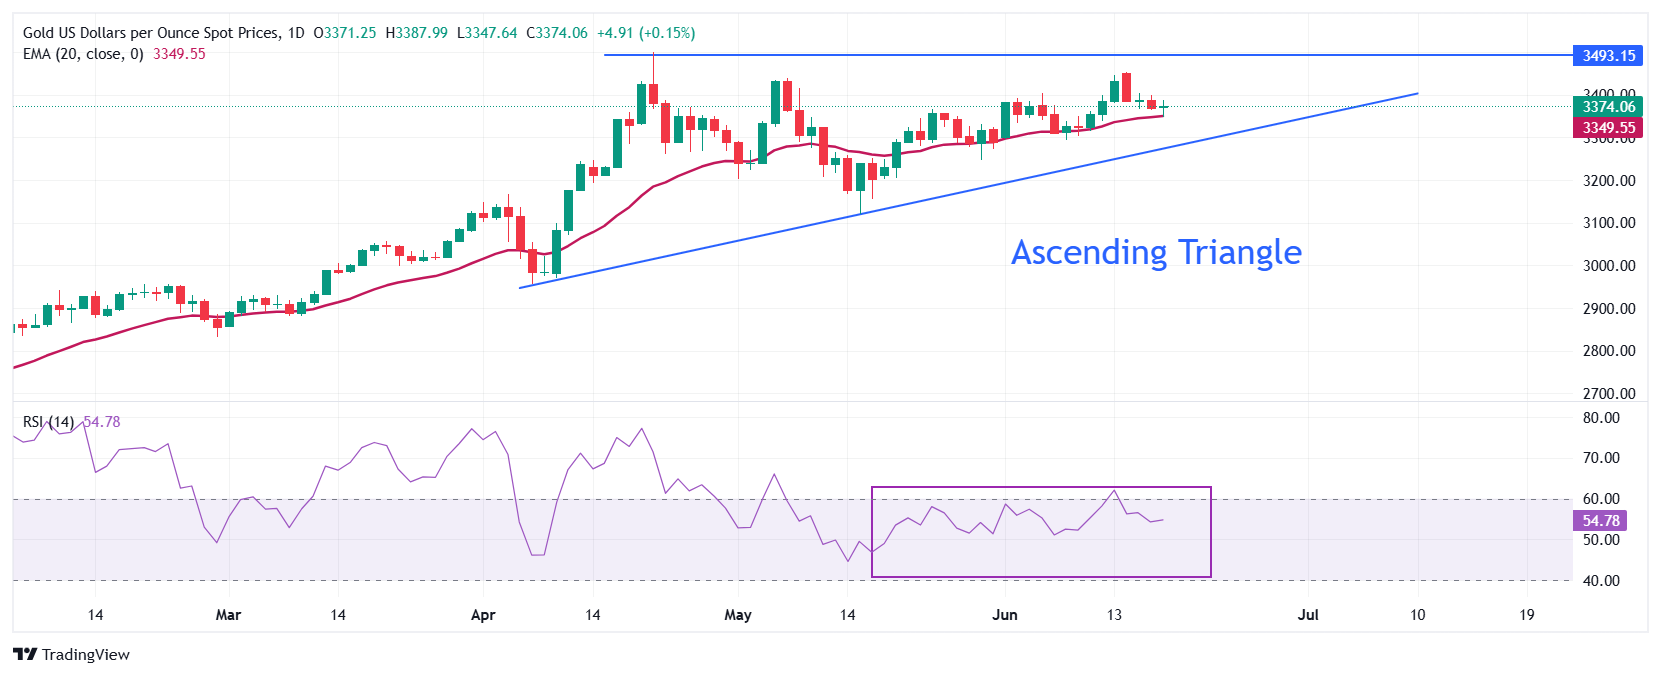
Gold price trades in an Ascending Triangle formation on a daily timeframe, which indicates volatility contraction. The horizontal resistance of the above-mentioned chart pattern is plotted from the April 22 high around $3,500, while the upward-sloping trendline is placed from the April 7 low of $2,957.
The 20-day Exponential Moving Average (EMA) continues to provide support to the Gold price around $3,350
The 14-day Relative Strength Index (RSI) struggles to break above 60.00. A fresh bullish momentum would emerge if the RSI breaks above that level.
Looking up, the Gold price would enter in an unchartered territory after breaking above the psychological level of $3,500 decisively. Potential resistances would be $3,550 and $3,600.
Alternatively, a downside move by the Gold price below the May 29 low of $3,245 would drag it towards the round-level support of $3,200, followed by the May 15 low at $3,121.
Gold daily chart
Gold FAQs
Gold has played a key role in human’s history as it has been widely used as a store of value and medium of exchange. Currently, apart from its shine and usage for jewelry, the precious metal is widely seen as a safe-haven asset, meaning that it is considered a good investment during turbulent times. Gold is also widely seen as a hedge against inflation and against depreciating currencies as it doesn’t rely on any specific issuer or government.
Central banks are the biggest Gold holders. In their aim to support their currencies in turbulent times, central banks tend to diversify their reserves and buy Gold to improve the perceived strength of the economy and the currency. High Gold reserves can be a source of trust for a country’s solvency. Central banks added 1,136 tonnes of Gold worth around $70 billion to their reserves in 2022, according to data from the World Gold Council. This is the highest yearly purchase since records began. Central banks from emerging economies such as China, India and Turkey are quickly increasing their Gold reserves.
Gold has an inverse correlation with the US Dollar and US Treasuries, which are both major reserve and safe-haven assets. When the Dollar depreciates, Gold tends to rise, enabling investors and central banks to diversify their assets in turbulent times. Gold is also inversely correlated with risk assets. A rally in the stock market tends to weaken Gold price, while sell-offs in riskier markets tend to favor the precious metal.
The price can move due to a wide range of factors. Geopolitical instability or fears of a deep recession can quickly make Gold price escalate due to its safe-haven status. As a yield-less asset, Gold tends to rise with lower interest rates, while higher cost of money usually weighs down on the yellow metal. Still, most moves depend on how the US Dollar (USD) behaves as the asset is priced in dollars (XAU/USD). A strong Dollar tends to keep the price of Gold controlled, whereas a weaker Dollar is likely to push Gold prices up.
Author

Sagar Dua
FXStreet
Sagar Dua is associated with the financial markets from his college days. Along with pursuing post-graduation in Commerce in 2014, he started his markets training with chart analysis.

















