Gold Price Forecast: XAU/USD trades in tight range around $3,300 ahead of US NFP data
- Gold price wobbles around $3,300 as investors await the US NFP data for July.
- Traders trimmed bets supporting interest rate cuts by the Fed in the September meeting.
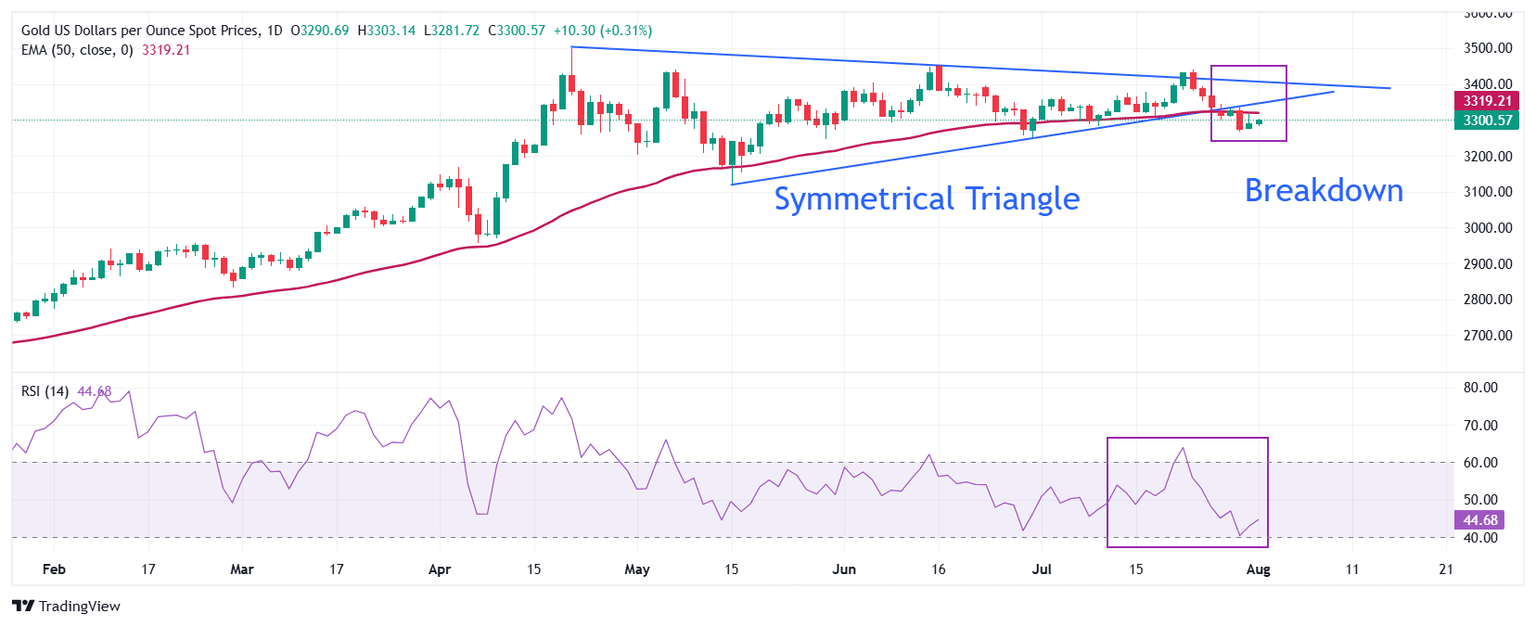
- The 50-day EMA has capped the Gold price’s upside.

Gold price consolidates in a limited range around $3,300 during the late European trading session on Friday. The precious metal wobbles as investors await the United States (US) Nonfarm Payrolls (NFP) data for July, which will be published at 12:30 GMT.
Investors will closely monitor the US NFP data as it will influence market expectations for the Federal Reserve’s (Fed) monetary policy outlook.
Economists expect the US economy to have added 110K fresh workers, lower than 147K jobs created in June. The Unemployment Rate is seen higher at 4.2%, against 4.1% in June. Meanwhile, Average Hourly Earnings, a key measure of wage growth, is estimated to have grown at a faster pace on monthly as well as on annual basis.
Lately, traders have pared bets supporting interest rate cuts by the Fed in the September policy meeting. According to the CME FedWatch tool, the probability for the Fed to cut interest rates in the September meeting has diminished to 39.2% from 58.4% seen a week ago.
Traders trimmed Fed dovish bets as Chairman Jerome Powell, in its press conference on Wednesday, signaled no rush for interest rate cuts, citing that the economy is in a “solid position” and inflation is “somewhat above target”. Powell also warned that the impact of tariffs has started showing up into prices.
Higher interest rates by the Fed bode poorly for non-yielding assets, such as Gold.
Gold technical analysis
Gold price bounces back to retest the breakdown region of the Symmetrical Triangle formation around$3.320. The 50-day Exponential Moving Average (EMA) acts as key barrier for the gold price around $3,320.
The14-day Relative Strength Index (RSI) slides to near $40.00. A fresh bearish momentum would emerge if the RSI breaks below that level.
Looking down, the Gold price would fall towards the round-level support of $3,200 and the May 15 low at $3,121, if it breaks below the May 29 low of $3,245
Alternatively, the Gold price will enter an uncharted territory if it breaks above the psychological level of $3,500 decisively. Potential resistances would be $3,550 and $3,600.
Gold daily chart
Gold FAQs
Gold has played a key role in human’s history as it has been widely used as a store of value and medium of exchange. Currently, apart from its shine and usage for jewelry, the precious metal is widely seen as a safe-haven asset, meaning that it is considered a good investment during turbulent times. Gold is also widely seen as a hedge against inflation and against depreciating currencies as it doesn’t rely on any specific issuer or government.
Central banks are the biggest Gold holders. In their aim to support their currencies in turbulent times, central banks tend to diversify their reserves and buy Gold to improve the perceived strength of the economy and the currency. High Gold reserves can be a source of trust for a country’s solvency. Central banks added 1,136 tonnes of Gold worth around $70 billion to their reserves in 2022, according to data from the World Gold Council. This is the highest yearly purchase since records began. Central banks from emerging economies such as China, India and Turkey are quickly increasing their Gold reserves.
Gold has an inverse correlation with the US Dollar and US Treasuries, which are both major reserve and safe-haven assets. When the Dollar depreciates, Gold tends to rise, enabling investors and central banks to diversify their assets in turbulent times. Gold is also inversely correlated with risk assets. A rally in the stock market tends to weaken Gold price, while sell-offs in riskier markets tend to favor the precious metal.
The price can move due to a wide range of factors. Geopolitical instability or fears of a deep recession can quickly make Gold price escalate due to its safe-haven status. As a yield-less asset, Gold tends to rise with lower interest rates, while higher cost of money usually weighs down on the yellow metal. Still, most moves depend on how the US Dollar (USD) behaves as the asset is priced in dollars (XAU/USD). A strong Dollar tends to keep the price of Gold controlled, whereas a weaker Dollar is likely to push Gold prices up.
Author

Sagar Dua
FXStreet
Sagar Dua is associated with the financial markets from his college days. Along with pursuing post-graduation in Commerce in 2014, he started his markets training with chart analysis.


