Gold Price Forecast: XAU/USD targets $1791 on turnaround Tuesday – Confluence Detector
- Gold price jumps 1% as the US dollar keeps losing ground across the board.
- Retreat in Treasury yields, risk-on mood aid the rebound in gold price.
- Gold: Sellers defend $1,800, all eyes on US T-bond yields.

Gold price is rebounding 1% so far this Tuesday, reversing half the sell-off seen since Friday, as bulls aim for the $1800 barrier once again. The relentless decline in the US dollar across the board is helping gold price stage an impressive turnaround. The risk-on flows are weighing heavily on the dollar’s safe-haven demand, underpinning gold price. Expectations of strong corporate earnings reports from the US, especially from the tech sector, has overshadowed the concerns over rising inflation and global economic growth. The retreat in the US Treasury yields is also boding well for gold price amid a data-light Tuesday.
Read: Gold Price Forecast: XAU/USD rebounds towards key $1795 barrier but downside risks remain intact
Gold Price: Key levels to watch
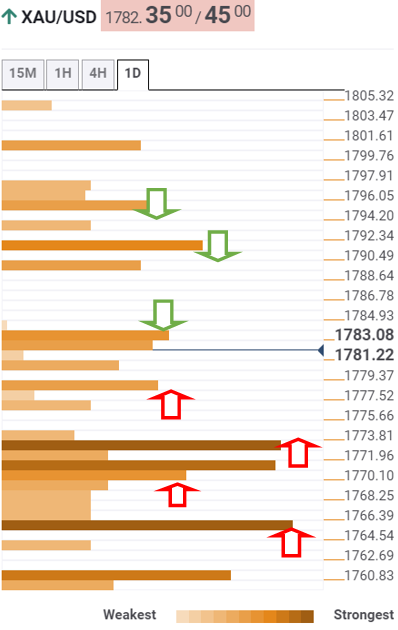
According to the Technical Confluences Detector, gold is on a steady road to recovery, now challenging the convergence of the pivot point one-day R3 and the previous high four-hour at $1783.
The next stop for gold bulls is seen around $1791, where the Fibonacci 23.6% one-week coincides with the Fibonacci 61.8% one-month.
Further up, the critical SMA200 one-day at $1795 will come into play. At that level, the pivot point one-week R1 intersects.
The previous week’s high at $1801 will then test the bearish commitments.
However, rejection at higher levels could recall the sellers to test the immediate support around $1778, the confluence of the SMA50 one-day and Bollinger Band four-hour Middle.
The next crucial cushion is seen at $1772, the meeting point of the previous day’s high and SMA200 four-hour.
A dense cluster of healthy support levels are placed around $1770, which will limit the additional downside in gold price.
The demand area is comprised of the Fibonacci 61.8% one-week, SMA50 four-hour and SMA200 one-hour.
The line in the sand for gold buyers appears at $1765, the convergence of the Fibonacci 38.2% one-month and one-day.
Here is how it looks on the tool
About Technical Confluences Detector
The TCD (Technical Confluences Detector) is a tool to locate and point out those price levels where there is a congestion of indicators, moving averages, Fibonacci levels, Pivot Points, etc. If you are a short-term trader, you will find entry points for counter-trend strategies and hunt a few points at a time. If you are a medium-to-long-term trader, this tool will allow you to know in advance the price levels where a medium-to-long-term trend may stop and rest, where to unwind positions, or where to increase your position size.
Author

Dhwani Mehta
FXStreet
Residing in Mumbai (India), Dhwani is a Senior Analyst and Manager of the Asian session at FXStreet. She has over 10 years of experience in analyzing and covering the global financial markets, with specialization in Forex and commodities markets.


