Gold Price Forecast: XAU/USD targets $1,903 and $1,891 as bond rout extends – Confluence Detector
- Gold price extends declines, as the US Treasury yields keep rallying amidst the bond rout.
- Hopes for diplomacy in the Ukraine crisis fail to deter USD bulls, as focus shifts to NFP.
- Gold’s path of least resistance appears down, Ukraine updates eyed.

Gold price remains in the red so far this week, as the US Treasury bonds see no reprieve, leading to the relentless surge in the yields. The US dollar is tracking the rates higher, weighing heavily on gold price. Hopes for progress on the Russia-Ukraine peace talks are boosting the overall market mood, adding to gold’s plight. The incoming updates from the negotiations and sentiment around the US yields will remain the main market drivers ahead of Friday’s critical Nonfarm Payrolls release.
Read: Gold breaks strong support at 1937/34 to turn the outlook negative now [Video]
Gold Price: Key levels to watch
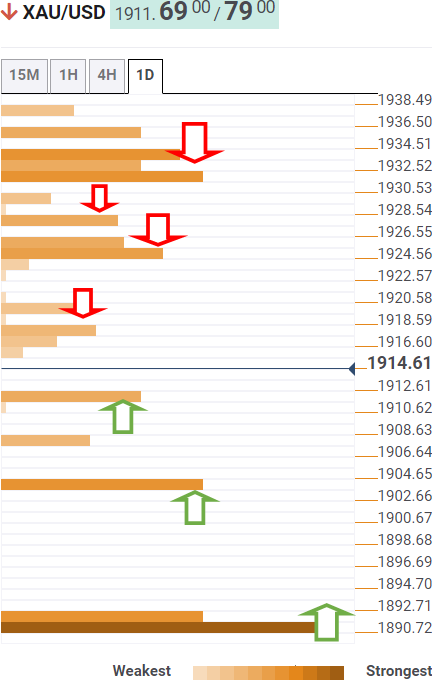
The Technical Confluences Detector shows that gold price has smashed critical demand areas, now testing the previous week’s low of $1,911.
The next downside target is seen at the pivot point one-day S1, below which a test of the Fibonacci 38.2% one-month at $1,903 will be on the cards.
A fresh sell-off towards $1,891 will be initiated on a sustained breach of the latter. That level is the confluence of the pivot point one-week S2, SMA50 one-day and pivot point one-day S2.
Alternatively, the previous day’s low of $1,917 will guard the immediate upside, above which gold bulls will need to crack a dense cluster of resistance levels stacked up around $1,925.
At that point, the SMA5 four-hour and the pivot point one-week S1 coincide.
The next resistance awaits at the Fibonacci 23.6% one-day at $1,928.
A powerful barrier at $1,933, the intersection of the Fibonacci 38.2% one-day, 61.8% one-week and 23.6% one-month, will be the level to beat for gold bulls.
Here is how it looks on the tool
About Technical Confluences Detector
The TCD (Technical Confluences Detector) is a tool to locate and point out those price levels where there is a congestion of indicators, moving averages, Fibonacci levels, Pivot Points, etc. If you are a short-term trader, you will find entry points for counter-trend strategies and hunt a few points at a time. If you are a medium-to-long-term trader, this tool will allow you to know in advance the price levels where a medium-to-long-term trend may stop and rest, where to unwind positions, or where to increase your position size.
Author

Dhwani Mehta
FXStreet
Residing in Mumbai (India), Dhwani is a Senior Analyst and Manager of the Asian session at FXStreet. She has over 10 years of experience in analyzing and covering the global financial markets, with specialization in Forex and commodities markets.


