Gold Price Forecast: XAU/USD stays bearish below $1,680 hurdle, focus on central banks – Confluence Detector
- Gold price holds lower ground near two-year bottom flashed on Fed day.
- Risk-aversion, firmer DXY joins downside break of $1,680 level to keep bears hopeful.
- Multiple central bankers are in line to woo market players, hawkish moves could weigh on XAU/USD.

Gold price (XAU/USD) reverses the bounce off two-year low year, marked the previous day, as risk-aversion intensifies ahead of the key central bank events. That said, the metal’s latest weakness could also be linked to the US Federal Reserve’s (Fed) third rate hike worth 75 basis points (bps) and hopes of a painful journey to tame inflation moving forward. Additionally, global agitation towards Russia’s mobilization of troops and fears surrounding China are extra negatives for the metal prices. Above all, the metal’s sustained downside break of the $1,680 key support keeps the bears hopeful as multiple central banks are likely to follow the Fed’s hawkish path.
Also read: Gold Price Forecast: XAU/USD awaits bear pennant confirmation for a fresh downswing
Gold Price: Key levels to watch
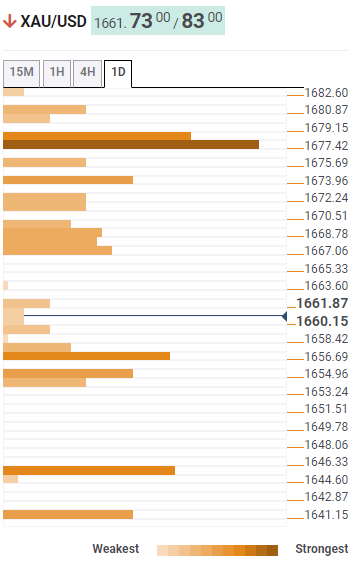
The Technical Confluence Detector shows that the gold price has breached the $1,680 support confluence comprising the previous yearly low and the pivot point one month S1.
With this, the bears are now bracing for the fresh multi-month low, which in turn highlights the pivot point one-day S1 and lower-end of the Bollinger on one-day, around $1,657.
Following that, the previous weekly low near $1,655 may offer an intermediate halt during the metal’s further downside before directing it towards the pivot point one month S2, near $1,644.
Meanwhile, recovery moves could initially attack the SMA10 1H and the Fibonacci 61.8% one day, around $1,667. However, major attention will be given to the $1,680 level during the XAU/USD’s further advances.
In a case where the gold price rise beyond $1,680, the odds of witnessing a run-up towards $1,700 can’t be ruled out.
Here is how it looks on the tool
About Technical Confluences Detector
The TCD (Technical Confluences Detector) is a tool to locate and point out those price levels where there is a congestion of indicators, moving averages, Fibonacci levels, Pivot Points, etc. If you are a short-term trader, you will find entry points for counter-trend strategies and hunt a few points at a time. If you are a medium-to-long-term trader, this tool will allow you to know in advance the price levels where a medium-to-long-term trend may stop and rest, where to unwind positions, or where to increase your position size.
Author

Anil Panchal
FXStreet
Anil Panchal has nearly 15 years of experience in tracking financial markets. With a keen interest in macroeconomics, Anil aptly tracks global news/updates and stays well-informed about the global financial moves and their implications.


