- Gold price has shifted comfortably above $1,970.00 ahead of FOMC minutes.
- The release of May’s FOMC minutes will provide a detailed explanation behind 25 bps interest rate hike by the Fed.
- Mixed preliminary S&P PMI data (May) weighed on US Treasury yields.
Gold price (XAU/USD) has shifted its auction comfortably above the crucial resistance of $1,970.00 in the Asian session. The precious metal is expected to extend its rally further ahead of the release of the Federal Open Market Committee (FOMC) minutes for May’s monetary policy meeting on Wednesday.
S&P500 futures witnessed a steep fall on Tuesday, dragged by a sell-off in technology stocks. The market mood remained negative as the United States economy is getting closer to a situation of default as the Federal government will be out of funds by June 01. An absence of positive development in raising the US debt-ceiling is terrifying investors as a default by the US economy could result in chaos in global financial markets and a spike in interest rates.
The US Dollar Index (DXY) is showing signs of volatility contraction after gaining to near the previous week’s high above 103.60. Going forward, the release of May’s FOMC minutes will provide a detailed explanation behind the 25 basis points (bps) interest rate hike by the Federal Reserve (Fed). Also, it will provide cues about upcoming policy action.
Meanwhile, the release of the mixed preliminary S&P PMI data (May) weighed on US Treasury yields. The Yields offered on 10-year US government bonds dropped below 3.70%.
Gold technical analysis
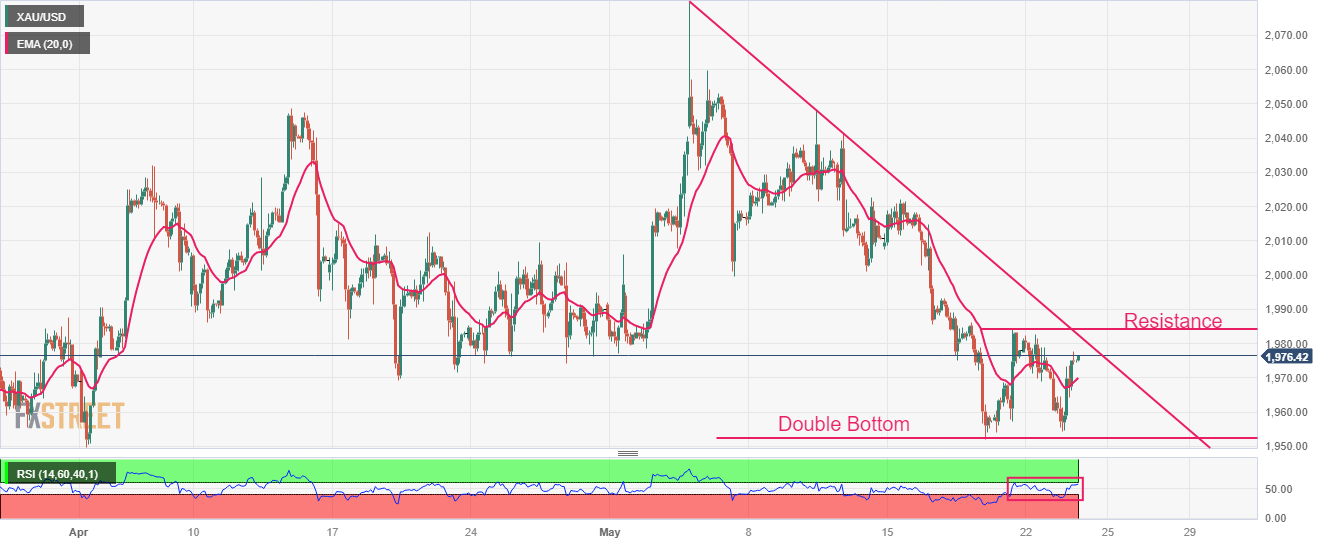
Gold price has shown a stellar recovery after a Double Bottom formation plotted from May 18 low at $1,952.01, which indicates a bullish reversal. Gold bulls will get further strength after breaking above the immediate resistance placed from March 19 high at $1,984.25. The downward-sloping trendline market from all-time highs at $2,079.76 will act as a major barrier for the Gold price.
The yellow metal has climbed above the 20-period Exponential Moving Average (EMA) at $1,970.00, which indicates that the short-term trend has turned positive.
Meanwhile, the Relative Strength Index (RSI) (14) has shifted into the 40.00-60.00 range from the bearish range of 20.00-40.00, which signals that the downside momentum has faded.
Gold hourly chart
Information on these pages contains forward-looking statements that involve risks and uncertainties. Markets and instruments profiled on this page are for informational purposes only and should not in any way come across as a recommendation to buy or sell in these assets. You should do your own thorough research before making any investment decisions. FXStreet does not in any way guarantee that this information is free from mistakes, errors, or material misstatements. It also does not guarantee that this information is of a timely nature. Investing in Open Markets involves a great deal of risk, including the loss of all or a portion of your investment, as well as emotional distress. All risks, losses and costs associated with investing, including total loss of principal, are your responsibility. The views and opinions expressed in this article are those of the authors and do not necessarily reflect the official policy or position of FXStreet nor its advertisers. The author will not be held responsible for information that is found at the end of links posted on this page.
If not otherwise explicitly mentioned in the body of the article, at the time of writing, the author has no position in any stock mentioned in this article and no business relationship with any company mentioned. The author has not received compensation for writing this article, other than from FXStreet.
FXStreet and the author do not provide personalized recommendations. The author makes no representations as to the accuracy, completeness, or suitability of this information. FXStreet and the author will not be liable for any errors, omissions or any losses, injuries or damages arising from this information and its display or use. Errors and omissions excepted.
The author and FXStreet are not registered investment advisors and nothing in this article is intended to be investment advice.
Recommended content
Editors’ Picks
AUD/USD remained bid above 0.6500
AUD/USD extended further its bullish performance, advancing for the fourth session in a row on Thursday, although a sustainable breakout of the key 200-day SMA at 0.6526 still remain elusive.
EUR/USD faces a minor resistance near at 1.0750
EUR/USD quickly left behind Wednesday’s small downtick and resumed its uptrend north of 1.0700 the figure, always on the back of the persistent sell-off in the US Dollar ahead of key PCE data on Friday.
Gold holds around $2,330 after dismal US data
Gold fell below $2,320 in the early American session as US yields shot higher after the data showed a significant increase in the US GDP price deflator in Q1. With safe-haven flows dominating the markets, however, XAU/USD reversed its direction and rose above $2,340.
Bitcoin price continues to get rejected from $65K resistance as SEC delays decision on spot BTC ETF options
Bitcoin (BTC) price has markets in disarray, provoking a broader market crash as it slumped to the $62,000 range on Thursday. Meanwhile, reverberations from spot BTC exchange-traded funds (ETFs) continue to influence the market.
US economy: slower growth with stronger inflation
The dollar strengthened, and stocks fell after statistical data from the US. The focus was on the preliminary estimate of GDP for the first quarter. Annualised quarterly growth came in at just 1.6%, down from the 2.5% and 3.4% previously forecast.