Gold Price Forecast: XAU/USD slide as US yields soar after Fitch’s downgrades US debt
- XAU/USD extended its drop as US bond yields, particularly 10s, climbed above 4%.
- The credit rating agency’s downgrade of US Government debt from AAA to AA+ has impacted market sentiment, leading investors towards safety in the US Dollar and Japanese Yen.
- ADP National Employment report showed that private hiring grew by 324K, exceeding estimates, ahead of Friday’s crucial Nonfarm Payrolls data.

Gold price extends its drop to two consecutive days as US bond yield climb due to market sentiment shifting sour. That, alongside US Dollar (USD) strength following an upbeat US jobs report, is the primary driver of XAU/USD’s price action. At the time of writing, the XAU/USD is trading at $1,937.75, down 0.73%.
Gold price dips for the second straight day as US yields rise, boosting the US Dollar
Wall Street treads water as sentiment remains depressed following Fitch’s downgrading of debt of the United States (US). Despite that, US Treasury bond yields rose, led by the US 10-year benchmark note rate at 4.067%, which gains four basis points after reaching 4.126% during the North American session.
Fitch’s revision to US Government debt from AAA to AA+ was blamed “on a perceived deterioration in US governance, which it said gave less confidence in the government’s ability to address fiscal and debt issues,” according to sources cited by Reuters. Hence, market participants sought safety, with the US Dollar and the Japanese Yen (JPY) leaders in Wednesday’s session.
In the meantime, the ADP National Employment report flashed that private hiring grew by 324K exceeding estimates of 189K, ahead of July’s US Nonfarm Payrolls data on Friday, with forecasts circa 200K people added to the workforce.
Regarding Tuesday’s data, the ISM Manufacturing PMI came at recessionary territory below the 50 figure for the ninth straight month, though it continued to improve; compared to June’s 46, it arrived at 46.4. Even though it was an improvement, the trend appears to slow down.
In the meantime, the US Dollar Index (DXY), a measure of the buck’s value against a basket of six currencies, advances 0.54% at 102.514, prolonging its gains to six straight days, with traders eyeing a break above the 100-day EMA at 102.561.
XAU/USD Price Analysis: Technical outlook
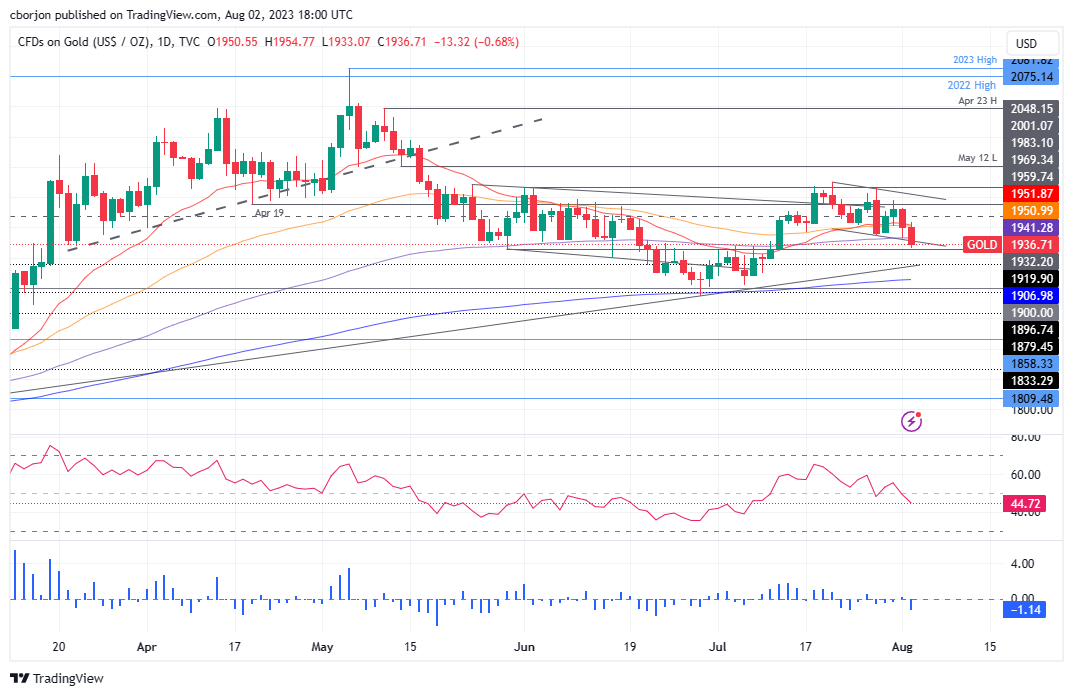
Although XAU/USD achieved a higher high on Friday 20 daily high at $1,987.42, the XAU/USD retraced back below the $1,950 area, extending its losses below the 20 and 50-day Exponential Moving Averages (EMAs), at $1,952.02 and $1,951.05, respectively. Additionally, XAU/USD dropped under the 100-day EMA, opening the door for further downside. Nevertheless, the emergence of a ‘bullish flag’ can pave the way for further upside, with prices edging toward $2,000. On the flip side, if XAU/USD falls below $1,933.07, that would exacerbate a dip toward the 200-day EMA at $1,906.99.
Author

Christian Borjon Valencia
FXStreet
Markets analyst, news editor, and trading instructor with over 14 years of experience across FX, commodities, US equity indices, and global macro markets.


