|

Gold Price Forecast: XAU/USD sees cushion around $1,830, Fed Powell in focus

  • Gold price is gauging support around $1,830.00 ahead of Fed Powell.
  • Fed Powell may dictate the ideology behind announcing the 75 bps rate hike in June.
  • The momentum oscillator RSI (14) is advocating a consolidative move ahead.

Gold prices (XAU/USD) are testing the waters after a strong rebound below $1,830 in the late New York session. The precious metal has displayed a firmer responsive buying action but needs more filters to confirm a bullish reversal. Broadly, a gradual downside move could be named to the recent move in the asset as investors are keeping an eye on Federal Reserve (Fed) chair Jerome Powell’s testimony.

The Fed has already elevated its interest rates by 75 basis points (bps) to 1.50-1.75% officially this month. It would be worth noting the guidance on upcoming monetary policies. Apart from that, Fed Powell in May monetary policy conference dictated that a 75 bps rate hike is not into consideration. In spite of that, Fed Powell went beyond his statement and featured a bumper rate hike. It is important to understand the ideology behind selecting the 75 bps rate hike.

Meanwhile, the US dollar index (DXY) has turned sideways ahead of Fed Powell’s testimony. On Tuesday, the DXY rebounded firmly after hitting the round-level support of 104.00. The 10-year US Treasury yields remained flat on Tuesday at around 3.30%.

Gold technical analysis

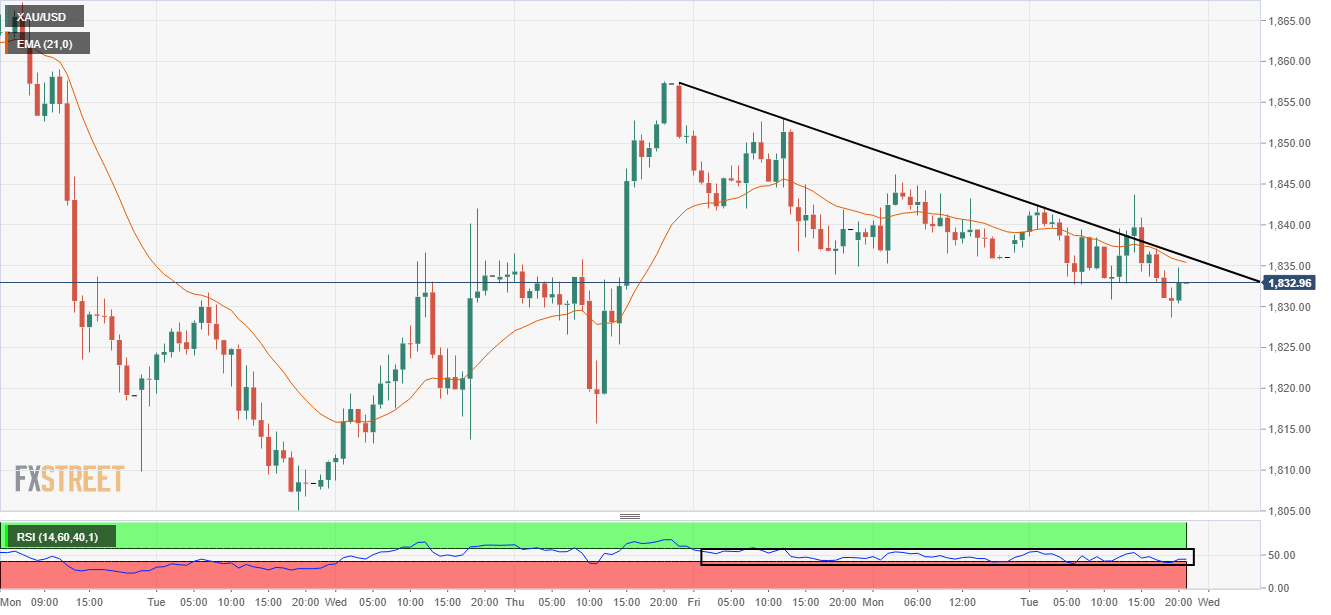
The trendline placed from June 16 high at $1,857.40, adjoining Friday’s high at $1,853.04 will act as a major resistance for the gold prices going forward. The precious metal is auctioning below the 21-period Exponential Moving Average (EMA) at $1,835.24, which signals a short-term weakness in the counter.  Meanwhile, the Relative Strength Index (RSI) (14) has shifted into a 40.00-60.00 range, which signals a consolidation ahead.

Gold hourly chart

XAU/USD

Overview
Today last price1832.96
Today Daily Change-3.11
Today Daily Change %-0.17
Today daily open1836.07
 
Trends
Daily SMA201847.23
Daily SMA501872.33
Daily SMA1001890.88
Daily SMA2001843.22
 
Levels
Previous Daily High1846.18
Previous Daily Low1834.9
Previous Weekly High1879.26
Previous Weekly Low1805.11
Previous Monthly High1909.83
Previous Monthly Low1786.94
Daily Fibonacci 38.2%1839.21
Daily Fibonacci 61.8%1841.87
Daily Pivot Point S11831.92
Daily Pivot Point S21827.77
Daily Pivot Point S31820.64
Daily Pivot Point R11843.2
Daily Pivot Point R21850.33
Daily Pivot Point R31854.48

Author

Sagar Dua

Sagar Dua

FXStreet

Sagar Dua is associated with the financial markets from his college days. Along with pursuing post-graduation in Commerce in 2014, he started his markets training with chart analysis.

More from Sagar Dua
Share:

Editor's Picks

EUR/USD looks to regain the 200-day SMA

EUR/USD regains some balance and trade just above 1.1600 the figure ahead of the opening bell in Asia. The pair initially dipped to the 1.1530 zone for the first time since November, always following the stronger US Dollar and the marked flight-to-safety in the context of the ongoing Middle East crisis
 

GBP/USD slips below key averages as geopolitical risks mount

GBP/USD fell about 0.35% on Tuesday, settling around 1.3350 after slipping below the 200-day Exponential Moving Average for the first time since early December. The pair has pulled back sharply from its late-January high near 1.3870, shedding over 500 pips in a series of lower highs and lower lows. 

Gold falls to near $5,100 as inflation fears weigh amidst Middle East conflict

Gold price faces some selling pressure near $5,100 during the early Asian session on Wednesday. The precious metal falls amid a renewed US Dollar demand and dimming prospects for US rate cuts. The US ISM Services Purchasing Managers Index report will be published later on Wednesday. 

Ethereum: Whales step up buying as short positions contract

After holding firm heading into the last weekend, Ethereum whales have returned to action, pouncing on the volatility stemming from escalating military actions between the US and Iran.

Energy shock 2.0: Why rising Gas prices could hit the Euro

Even without a confirmed, sustained disruption, the mere risk to a key global energy chokepoint is enough to inject a significant premium into European Gas markets. And for the Euro, that matters.

Ripple falters amid sell-off jitters and negative funding rates

Ripple (XRP) has come under pressure, drifting lower to $1.35 at the time of writing on Tuesday. The over 2% correction looks poised to erase the previous day’s gains, which lifted the remittance token to $1.42.