Gold Price Forecast: XAU/USD drops below $1,970 as Fed expresses more rate hikes this year
- Gold price has slipped sharply below $1,970.00 as the Fed's policy-tightening intension could delay but is far from over.
- Monday’s Biden-McCarthy meeting concluded without an agreement but remained constructive at best.
- Gold price is anticipated to deliver a sheer downside after a breakdown below the demand zone placed in a range of $1,950-1,970.

Gold price (XAU/USD) has failed in defending its immediate support of $1,970.00 in the Asian session. The precious metal has dropped firmly as the Federal Reserve (Fed) policymakers are confident that more interest rate hikes by the central bank are in the pipeline in the fight against stubborn United States inflation.
S&P500 futures have added more gains in the Asian session, portraying a strong recovery in the risk appetite. It seems that investors are confident that US President Joe Biden will get the US debt-ceiling increase ahead. However, Monday’s meeting between US Biden and House of Representatives Kevin McCarthy concluded without an agreement but remained constructive at best.
US Biden has called partisan terms from Republicans as ‘extreme’ as the latter is not allowing extra taxes on the Wealthy community despite Democrats getting ready for some spending cuts. Meanwhile, US Treasury Secretary Janet Yellen is constantly reminding related authorities that the United States economy is moving towards a default swiftly as June 01 is the deadline for addressing obligated payments.
Meanwhile, St. Louis Fed Bank President James Bullard said on Monday that the Fed wants to fight inflation amid a strong labor market. He further added that the policy rate will have to go higher this year, perhaps by 50 basis points (bps).
Gold technical analysis
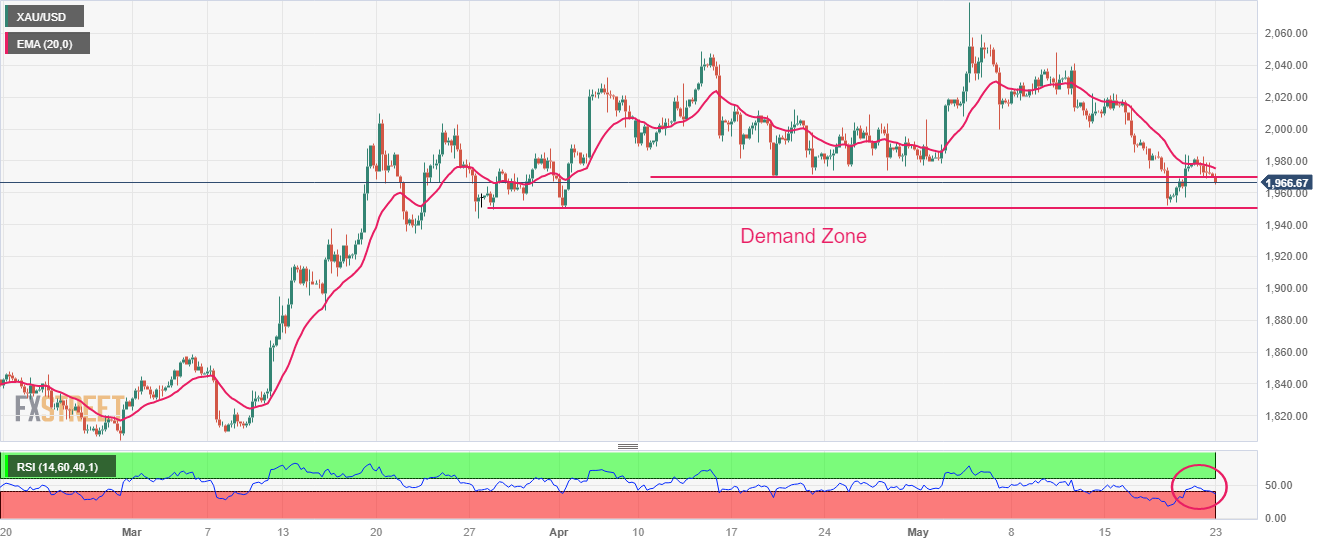
Gold price is anticipated to deliver a sheer downside after a breakdown below the demand zone placed in a range of $1,950-1,970 on a four-hour scale. The 20-period Exponential Moving Average (EMA) at $1,975.54 is acting as a barricade for the Gold bulls.
The Relative Strength Index (RSI) (14) has slipped back into the bearish range of 20.00-40.00, which signals that the downside momentum has been triggered again.
Gold four-hour chart
Author

Sagar Dua
FXStreet
Sagar Dua is associated with the financial markets from his college days. Along with pursuing post-graduation in Commerce in 2014, he started his markets training with chart analysis.


