Gold Price Forecast: XAU/USD rebounds to $1,850 as Fed's Powell to dodge hawkish guidance
- Gold price has picked up demand near $1,850.00 amid an improvement in investors’ risk appetite.
- Fed Powell might remain neutral in his testimony on the interest rate guidance.
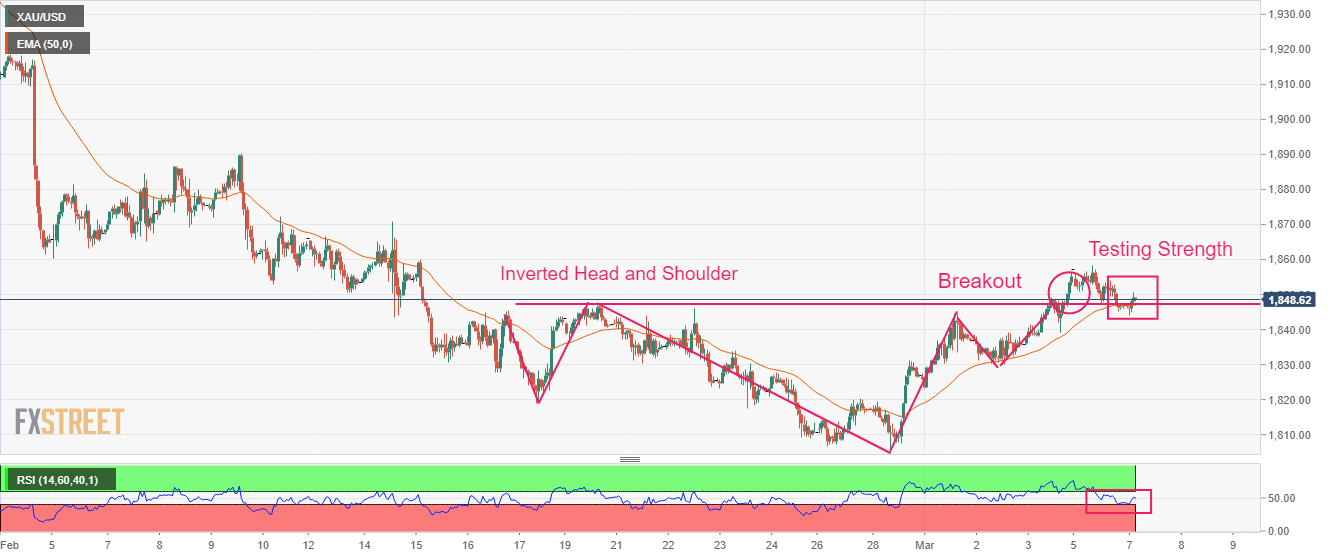
- Gold price is testing the breakout of the Inverted H&S chart pattern.

Gold price (XAU/USD) has shown a recovery move after a correction to near $1,844.00 in the Asian session. The precious metal has been supported by the improved risk appetite of the market participants. The US Dollar Index (DXY) looks vulnerable above 104.20 as the risk aversion theme is losing its grip.
S&P500 futures are adding some gains after a flat Monday. The return delivered on 10-year US Treasury yields has dropped below 3.97%. A sheer volatility is expected ahead as Federal Reserve (Fed) chair Jerome Powell will testify before Congress on Tuesday and Wednesday.
MUFG said “It doesn’t expect Fed Chair Jerome Powell to endorse that scale of further tightening” when the Fed chief takes to Capitol Hill to deliver his semi-annual testimony before Congress.
Analysts further added that Fed Powell is more likely to “wait to assess further data in the coming months to see if the strength in activity and inflation is sustained before strongly committing to more rate hikes.”
On the economic data front, United States Automatic Data Processing (ADP) Employment Change will remain in the spotlight. According to the estimates, the US economy added fresh 195K jobs in February, higher than the prior release of 105K. A higher-than-anticipated payrolls addition will bolster the expectations of one more 25 basis points (bps) interest rate hike by the Fed.
Gold technical analysis
Gold price is testing the strength of the Inverted Head and Shoulder chart pattern breakout on an hourly scale. The precious metal is auctioning near the neckline plotted from February high at $1847.00. An Inverted H&S pattern demonstrates a prolonged consolidation and a breakout of the same result in a bullish reversal.
The 50-period Exponential Moving Average (EMA) at $1,847.84 is providing support to the Gold bulls.
The Relative Strength Index (RSI) (14) has gauged cushion around 40.00. A reversal can be spotted at this level.
Gold hourly chart
Author

Sagar Dua
FXStreet
Sagar Dua is associated with the financial markets from his college days. Along with pursuing post-graduation in Commerce in 2014, he started his markets training with chart analysis.














