Gold Price Forecast: XAU/USD looks to recapture $1750 on its road to recovery
- Gold struggles to extend the rebound from a four-month low.
- US stimulus optimism, China data and covid updates trigger consolidation amid off in Japan.
- Tapering tantrums keeps bears hopeful amid firmer Treasury yields.

Update: Gold price is extending its sharp recovery rally from five-month lows of $1688 into the European session, as the bulls look to recapture the $1750 barrier. The retreat in the US dollar across the board from two-week tops could be associated with the pullback in gold price. Meanwhile, rising Chinese inflation combined with the renewed growth concerns in the world’s second-largest economy aided the swift retracement in the yellow metal. The progress on the US $1 trillion infrastructure bill also offered some support to the bright metal. Although the gains in the Treasury yields may cap its rebound going forward.
Gold price tumbled nearly 4.5% in early Asia after stops likely got triggered below the critical $1750 psychological level. Amid holiday-thinned market conditions, Asian traders reacted to solid US jobs data, which stoked concerns of a sooner-than-expected Fed’s tightening, exaggerating the sell-off in gold price.
Looking ahead, the dynamics in the US dollar and yields will continue to influence gold price while investors await fresh news on the US infrastructure bill and coronavirus.
Previous update: Gold (XAU/USD) fades the latest bounce off a four-month low near $1,688 to $1,740, down 1.4% intraday, heading into Monday’s European session. While US dollar consolidation and recovery in the market’s risk appetite seems to have triggered the gold price rebound, the bears remain hopeful amid the Fed’s tapering concerns and covid woes.
Gold extended Friday’s US NFP-led south-run during early Asia before bouncing off the lowest levels since March 31. The corrective pullback takes clues from the market’s optimism for the US infrastructure spending bill’s passage from the Senate as policymakers are up for the final voting on Tuesday.
Also favoring the yellow metal could be an off in Japan that restricts the US Treasury yields’ up-moves, strong catalysts behind the greenback’s latest jump. It’s worth noting that the bond coupons jumped the most in five months on Friday after the US jobs report flashed welcome signs for July, backing the Fed’s tapering concerns. As per the latest release, the headline Nonfarm Payrolls (NFP) jumped 943K versus 938K prior (revised from 850K), also crossing the market expectations of 870K. Further, the Unemployment Rate declined to 5.4% from 5.9% in June and the Labor Force Participation Rate improved modestly to 61.7%.
It should be noted that China’s upbeat inflation data and Australia’s easy covid infections, after refreshing multi-day high, also back the gold’s bounce.
Even so, fears of virus woes remain firm as Goldman revised down China’s growth forecasts and Yicai expects the pandemic to hurt the near-term recovery of the dragon nation. Also, Reuters’ piece said, Sunday, “New daily coronavirus cases in the United States have hit a six-month high, with the seven-day average reaching nearly 95,000. That rate is five times higher than it was less than a month ago.”
Hence, mildly upbeat markets sentiment could be a near-term phenomenon as the major challenges to the risk appetite remains on the table. That said, S&P 500 Futures drop 0.20% intraday while the US 10-year Treasury yields remain inactive around 1.30% by the press time.
Looking forward, updates over the US stimulus and covid news may entertain gold traders amid an absence of major data/events.
Technical analysis
Gold confirmed the double top bearish chart pattern on Friday by breaking $1,790 horizontal support. The daily closing below an ascending trend line from March also strengthened the bearish impulse. However, oversold RSI conditions backed the latest corrective pullback.
The same, however, remains less impactful for the gold buyers until the quote rises past the previous support line from March 31, around $1,784. Even so, the horizontal area surrounding $1,790 will test the recovery moves.
In a case where gold buyers keep reins past $1,790, 100-DMA and 50-DMA will challenge the upside bias, respectively around $1,804 and $1,815, before highlighting the one-month-old horizontal resistance near $1,832-34.
On the flip side, the $1,700 threshold could entertain the gold bears ahead of directing them to the recent low surrounding $1,688-87.
Though, a horizontal area comprising the yearly lows near $1,676, touched twice in March, will be a tough nut to crack for the gold sellers.
Gold: Daily chart
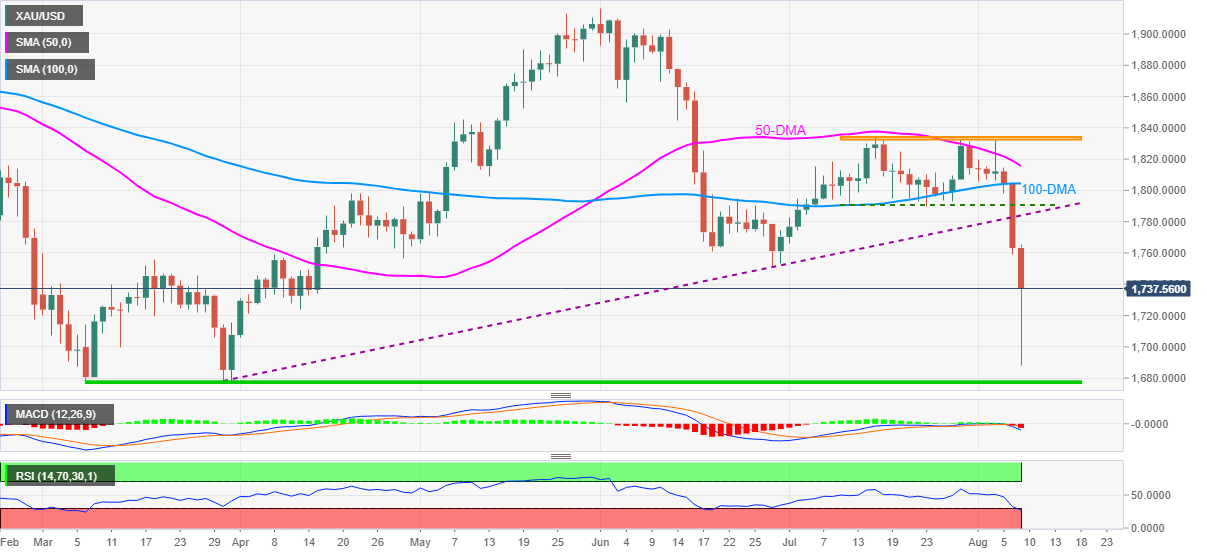
Trend: Bearish
Author

Anil Panchal
FXStreet
Anil Panchal has nearly 15 years of experience in tracking financial markets. With a keen interest in macroeconomics, Anil aptly tracks global news/updates and stays well-informed about the global financial moves and their implications.


