|

Gold Price Forecast: XAU/USD plunges to near $1,860 as DXY gets an adrenaline rush

  • Gold price has slipped sharply after failing to surpass $1,880.00n advancing hawkish Fed bets.
  • The DXY has crossed 104.50 amid higher price pressures and a tight labor market.
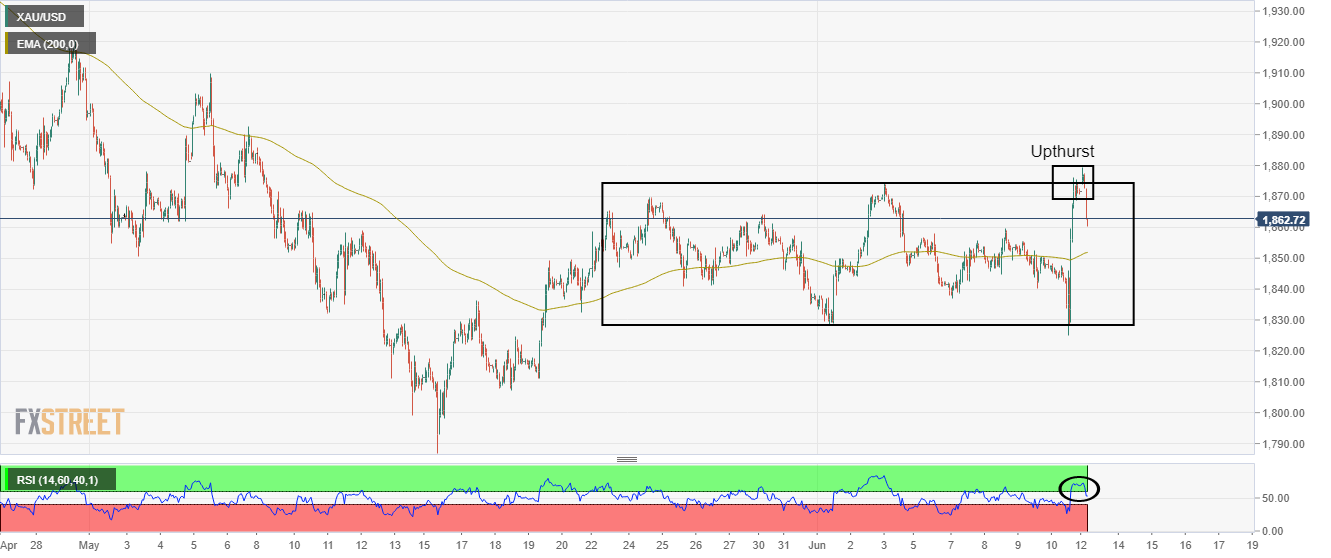
  • A formation of an upthrust in the gold prices indicates a buying climax.

Gold price (XAU/USD) has witnessed a vertical fall after failing to overstep the round-level resistance of $1,880.00. The precious metal advanced sharply on Friday above $1,870.00, attempted to balance above $1,870.00 in the early Asian session but failing to surpass $1,880.00 drifted the gold bulls lower.

A steel fall after an inventory distribution at the open is expected to bring more weakness in the counter. The gold prices have witnessed extreme selling pressure on rising odds of a 75 basis point (bps) interest rate hike by the Federal Reserve (Fed). Soaring price pressures and the upbeat Nonfarm Payrolls (NFP) are expected to compel the Fed to sound extremely hawkish.

The US Consumer Price Index (CPI) landed at 8.6%, higher than the estimates and the former figure of 8.3%. While, the core CPI was released at 6%, higher than the expectations of 5.9%.  This indicates that higher food and oil prices are contributing to the inflationary pressures.

Meanwhile, the US dollar index (DXY) is advanced strongly higher above 104.50 on expectations of an extreme hawkish policy by the Fed.

Gold technical analysis

On an hourly scale, the gold prices have witnessed a sell-off after forming an upthrust near $1,880.00, which signals a buying climax, followed by a bearish reversal. The precious metal is holding above the 200-Exponential Moving Average (EMA) at $1,852.20 but is expected to tumble further to near the critical support of $1,830.00. The Relative Strength Index (RSI) (14) has shifted into a 40.00-60.00 range from the bullish range of 60.00-80.00, which signals exhaustion in the upside trend.

Gold hourly chart

XAU/USD

Overview
Today last price1862.68
Today Daily Change-8.92
Today Daily Change %-0.48
Today daily open1871.6
 
Trends
Daily SMA201847.42
Daily SMA501884.18
Daily SMA1001890.16
Daily SMA2001842.33
 
Levels
Previous Daily High1876.01
Previous Daily Low1825.1
Previous Weekly High1876.01
Previous Weekly Low1825.1
Previous Monthly High1909.83
Previous Monthly Low1786.94
Daily Fibonacci 38.2%1856.56
Daily Fibonacci 61.8%1844.55
Daily Pivot Point S11839.13
Daily Pivot Point S21806.66
Daily Pivot Point S31788.22
Daily Pivot Point R11890.04
Daily Pivot Point R21908.48
Daily Pivot Point R31940.95

Author

Sagar Dua

Sagar Dua

FXStreet

Sagar Dua is associated with the financial markets from his college days. Along with pursuing post-graduation in Commerce in 2014, he started his markets training with chart analysis.

More from Sagar Dua
Share:

Markets move fast. We move first.

Orange Juice Newsletter brings you expert driven insights - not headlines. Every day on your inbox.

By subscribing you agree to our Terms and conditions.

Editor's Picks

EUR/USD remains below 1.1700 amid weakening momentum

EUR/USD remains steady after four days of losses, trading around 1.1680 during the Asian hours on Thursday. On the daily chart, the 14-day Relative Strength Index at 42.6 (neutral-bearish) indicates weakening momentum after slipping below the 50 midline. RSI staying sub-50 would keep bears engaged and limit recovery attempts.

GBP/USD consolidates above mid-1.3400s; bullish potential seems intact

The GBP/USD pair is seen consolidating its heavy losses registered over the past two days and oscillating in a narrow trading band, just above mid-1.3400s during the Asian session on Thursday. However, the fundamental backdrop warrants some caution for bearish traders and before positioning for an extension of the retracement slide from the 1.3565-1.3570 region, or the highest level since September 18, touched on Tuesday.

Gold: Deeper correction or dip-buying likely?

Gold is nursing losses near $4,450 in Asian trading on Thursday, having suffered about a 1% correction from weekly highs of $4,500 on Wednesday. All eyes remain on the geopolitical developments and the incoming US jobless claims data for fresh trading directives.

Top Crypto Losers: Pump.fun, Story, and Pudgy Penguins test key support levels

Pump.fun, Story, and Pudgy Penguins experience intense selling pressure over the last 24 hours. PUMP and IP failed to cross the 50-day Exponential Moving Average, resulting in a pullback on Wednesday, while PENGU is testing its 50-day EMA.

2026 economic outlook: Clear skies but don’t unfasten your seatbelts yet

Most years fade into the background as soon as a new one starts. Not 2025: a year of epochal shifts, in which the macroeconomy was the dog that did not bark. What to expect in 2026? The shocks of 2025 will not be undone, but neither will they be repeated.

XRP battles selling pressure as profit-taking, ETF inflows shape outlook

Ripple (XRP) is trading downward but holding support at $2.22 at the time of writing on Wednesday, as fear spreads across the cryptocurrency market, reversing gains made from the start of the year.