|

Gold Price Forecast: XAU/USD oscillates at a make or break around $1,710.00, US NFP eyed

  • Gold price bears are gaining momentum on soaring yields after Fed’s hawkish commentary.
  • Fed policymaker Evans sees interest rate hikes by 125 bps collectively in the remaining 2022.
  • The DXY will dance to the tunes of US NFP data ahead.

Gold price (XAU/USD) has slipped modestly after facing barricades of around $1,715.00 in the Tokyo session. The precious metal is expected to slip further to near $1,700.00 as yields are hovering at elevated levels amid hawkish commentaries from Federal Reserve (Fed) policymakers. The risk-off profile is extremely solid as S&P500 is expected to decline further.

Fed Governor Christopher Waller crosses wires on Thursday, stating that he sees little reason in the slow down of the policy tightening pace by the central bank. He further added that "Inflation is far from the FOMC’s goal and not likely to fall quickly,"

The commentary from Chicago Fed Bank President Charles L. Evans is more quantitative and provides specific targets ahead. Fed policymaker believes that the central bank will reach the targeted rate of 4.5-4.75% by the spring of 2023. And, the central bank will step up the interest rates by 125 basis points (bps) in the remaining two monetary policy meetings.

Meanwhile, the US dollar index (DXY) seems firmer around 112.26, and is likely to stretch its upside journey ahead of the US Nonfarm Payrolls (NFP) data. As per the consensus, the US economy added 250k jobs in September against the prior additions of 315k. The jobless rate is expected to remain constant at 3.7%.

Gold technical analysis

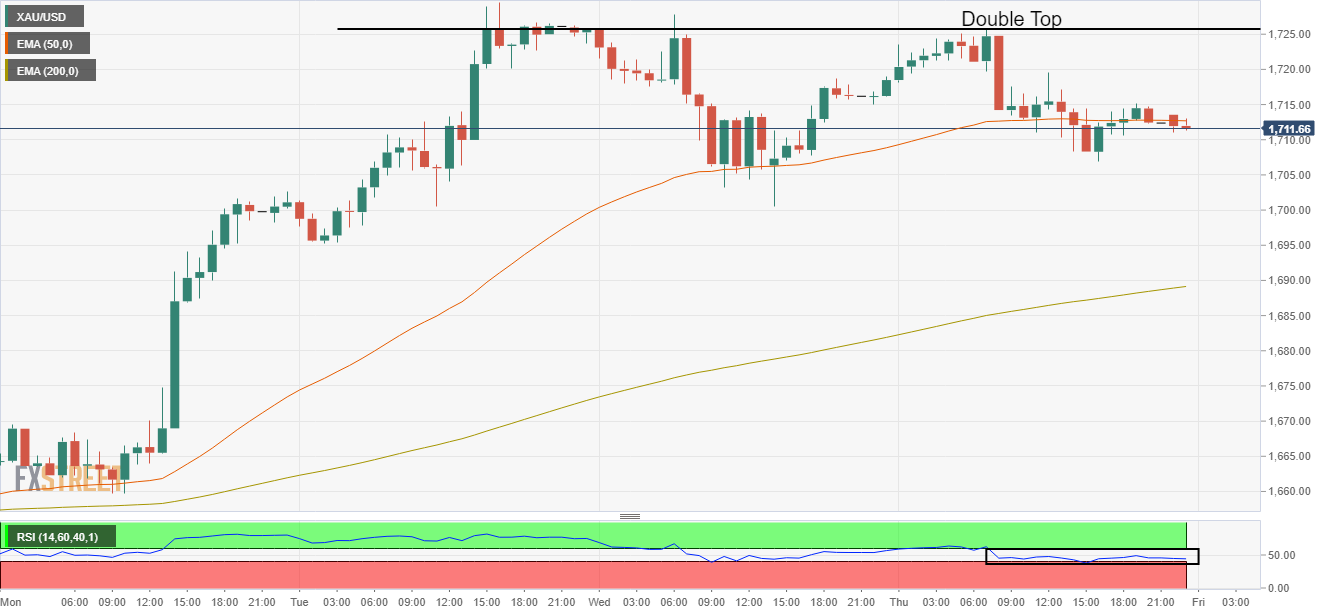
Gold prices have declined after failing to cross the weekly hurdle of $1,729.58 on Thursday. The asset has formed a Double Top chart pattern which indicates the unavailability of extreme strength while crossing the prior hurdle.  

The precious metal is oscillating around the 50-period Exponential Moving Average (EMA) at $1,712.00. The 200-EMA at $1,688.00 is still advancing, which states that the uptrend is still intact.

Meanwhile, the Relative Strength Index (RSI) (14) has shifted into the 40.00-60.00 range from the bullish range of 60.00-80.00.

Gold hourly chart

XAU/USD

Overview
Today last price1712.28
Today Daily Change-3.97
Today Daily Change %-0.23
Today daily open1716.25
 
Trends
Daily SMA201679.72
Daily SMA501724.38
Daily SMA1001762.48
Daily SMA2001823.19
 
Levels
Previous Daily High1727.85
Previous Daily Low1700.53
Previous Weekly High1675.49
Previous Weekly Low1614.85
Previous Monthly High1735.17
Previous Monthly Low1614.85
Daily Fibonacci 38.2%1710.97
Daily Fibonacci 61.8%1717.41
Daily Pivot Point S11701.9
Daily Pivot Point S21687.56
Daily Pivot Point S31674.58
Daily Pivot Point R11729.22
Daily Pivot Point R21742.2
Daily Pivot Point R31756.54


Author

Sagar Dua

Sagar Dua

FXStreet

Sagar Dua is associated with the financial markets from his college days. Along with pursuing post-graduation in Commerce in 2014, he started his markets training with chart analysis.

More from Sagar Dua
Share:

Editor's Picks

EUR/USD extends losses toward 1.1600 ahead of EU inflation data

EUR/USD extends the decline toward 1.1600 in the European session on Tuesday. The pair remains under pressure as surging energy prices amid the US-Iran war have increased the risks of higher inflation for the Old Continent. The focus is now on the Eurozone preliminary inflation reading for February. 

GBP/USD attacks 1.3300, refreshing three-month lows

GBP/USD is deep in the red near 1.3300, accelerating its downside to renew three-month lows in European trading on Tuesday. The ongoing escalation in the Iran war, combined with rising Oil prices, weighs negatively on the higher-yielding Pound Sterling as the US Dollar capitalizes on increased haven demand.

Gold weakens below $5,300 as sustained USD buying counter Middle East tensions

Gold attracts some intraday selling and falls around $100 from the daily top, around the $5,380 area. The US Dollar climbs to a fresh high since January 20 and turns  out to be a key factor exerting downward pressure on the commodity. However, concerns about a broader regional conflict in the Middle East continue to weigh on investors' sentiment and underpin demand for the traditional safe-haven bullion.

Stellar risks deeper losses as derivatives metrics turn negative

Stellar is trading red below $0.16 at the time of writing on Tuesday, after a slight recovery the previous day. Weakening derivatives data caps the recovery, while an unfavorable technical outlook projects a deeper correction for the XLM token in the upcoming days.

The market is not panicking it is repricing the probability distribution of Oil and time

At the end of the day, markets do not trade morality or geopolitics. They trade transmission channels. And the only channel that truly matters in this maelstrom runs through the price of energy and the time value of money.

Hyperliquid Price Forecast: HYPE rises on commodities demand amid US-Iran war

Hyperliquid (HYPE) steadies above $33 at press time on Tuesday, marking its fourth consecutive day of recovery in a broadly volatile market due to the ongoing US-Israel strikes on Iran.