- Gold price is advancing towards $1,800 as the US CPI is seen lower at 8.7%.
- The inflation rate is required to display a series of downward shifts to claim exhaustion.
- Gold price as defended the 20-EMA while the 50-EMA has remained untouched in a corrective move.
Gold price (XAU/USD) has slowed down its upside momentum after printing a high above $1,790.00 in the Asian session. The upside momentum has not been exhausted yet and the precious metal is balancing in a higher market profile after a sheer rally. The bright metal is advancing towards the psychological resistance of $1,800.00 on lower estimates for the US Consumer Price Index (CPI).
As per the market consensus, the US Consumer Price Index (CPI) is likely to trim to 8.7% from the prior release of 9.1%. A drop by 40 basis points in the consensus is backed by declining oil prices over the past few weeks. The black gold lost its mojo on accelerating recession fears and trimming supply worries. This may delight the Federal Reserve (Fed) to head a little soft this time on interest rates.
Investors should be aware of the fact that a one-time decline in the price pressures doesn’t warrant that the laborious job for the Federal Reserve (Fed) is over. The inflation rate is required to display a series of downward shifts to claim that the price pressures have exhausted.
Gold technical analysis
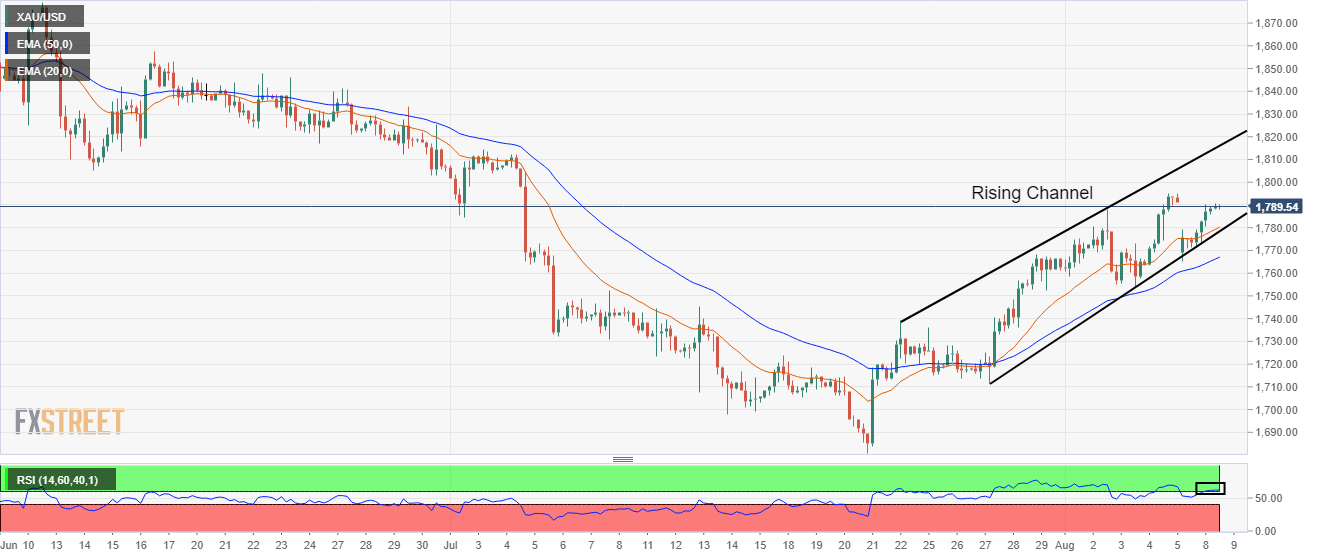
The gold prices have rebounded sharply after sensing bids around the lower portion of the Rising Channel formed on a four-hour scale. The upper portion of the above-mentioned chart pattern is placed from July 22 high at $1,739.37 while the lower portion is plotted from July 27 low at $1,711.55.
The gold bulls have defended the 20-period Exponential Moving Average (EMA) at $1,775.50. While, the 50-EMA at $1,767.11 has remained untouched despite a corrective move, which indicates that the short-term trend is extremely bullish.
Adding to that, the Relative Strength Index (RSI) (14) has attempted a break above 60.00 and an establishment above the same will strengthen the gold bulls further.
Gold four-hour chart
Information on these pages contains forward-looking statements that involve risks and uncertainties. Markets and instruments profiled on this page are for informational purposes only and should not in any way come across as a recommendation to buy or sell in these assets. You should do your own thorough research before making any investment decisions. FXStreet does not in any way guarantee that this information is free from mistakes, errors, or material misstatements. It also does not guarantee that this information is of a timely nature. Investing in Open Markets involves a great deal of risk, including the loss of all or a portion of your investment, as well as emotional distress. All risks, losses and costs associated with investing, including total loss of principal, are your responsibility. The views and opinions expressed in this article are those of the authors and do not necessarily reflect the official policy or position of FXStreet nor its advertisers. The author will not be held responsible for information that is found at the end of links posted on this page.
If not otherwise explicitly mentioned in the body of the article, at the time of writing, the author has no position in any stock mentioned in this article and no business relationship with any company mentioned. The author has not received compensation for writing this article, other than from FXStreet.
FXStreet and the author do not provide personalized recommendations. The author makes no representations as to the accuracy, completeness, or suitability of this information. FXStreet and the author will not be liable for any errors, omissions or any losses, injuries or damages arising from this information and its display or use. Errors and omissions excepted.
The author and FXStreet are not registered investment advisors and nothing in this article is intended to be investment advice.
Recommended content
Editors’ Picks
EUR/USD drops to fresh three-week lows despite US data

EUR/USD fell to 1.0770 during the American session, the lowest level in three weeks. The pair faces downward pressure, largely driven by a strong US Dollar. The Greenback remained resilient despite weaker-than-expected US data. On Thursday, more jobs data is due with Jobless Claims, ahead of Friday's NFP.
GBP/USD heads for fourth consecutive daily loss

GBP/USD broke below 1.2580 and fell to 1.2566, reaching the lowest level since November 24. The US Dollar stays relatively resilient despite softer US jobs data and lower Treasury yields.
Gold faces mixed risks, fails to capitalize on lower yields Premium

Gold recovered toward $2,030 after testing $2,020 earlier in the day. The benchmark 10-year US Treasury bond yield declined to its lowest level in three months below 4.15% after US employment data and helped XAU/USD gain traction.
XRP price aims at $0.7 as Ripple whales accumulate $37 million worth of tokens in three weeks

XRP price has been moving sideways for the past few days after greatly benefitting from the partial win it attained in the lawsuit filed by the Securities & Exchange Commission (SEC). However, Ripple’s CEO decided that the credit largely goes not to himself or the company but to its supporters.
WTI plunges below $70.00 in upbeat US inventory report, China’s economy concerns

The US crude oil benchmark dropped below $70.00 per barrel after a solid inventory report in the United States (US) concerned market participants, outweighing the drawdown in crude stocks. WTI is trading at $69.52, down more than 3%.