Gold Price Forecast: XAU/USD loses traction, closes in on $1,750
- Gold reversed its direction after climbing above $1,760 earlier in the day.
- US Dollar Index erased its losses supported by rising US T-bond yields.
- XAU/USD could extend its slide with a break below $1,750.

The XAU/USD pair capitalized on the modest bearish pressure surrounding the greenback and advanced to a daily high of $1,767 during the European trading hours before losing its traction. As of writing, the pair was down 0.35% on a daily basis at $1,755.
In the absence of high-impact data releases, fluctuations of the US Treasury bond yields seem to be impacting the USD's market valuation. The US Dollar Index, which touched a daily low of 94.08, was last seen flat on the day at 94.20 supported by a 1% increase seen in the benchmark 10-year US Treasury bond yield.
Earlier in the session, the data published by the US Department of Labor revealed on Thursday that there were 326,000 Initial Jobless Claims in the week ending October 2, compared to analysts' estimate of 350,000.
Meanwhile, US stock index futures are up between 0.9% and 1.1% on the day on renewed hopes of US lawmakers finding a temporary solution to the debt limit crisis. In case Wall Street's main indexes post strong gains after the opening bell, the greenback could struggle to continue to gather strength. Nevertheless, gold's upside could remain capped with the T-bond yields staying afloat in the positive territory.
Later in the day, Consumer Credit Change data will be featured in the US economic docket, which is likely to be ignored ahead of Friday's September jobs report.
US Nonfarm Payrolls September Preview: How far will markets go when the Fed tapers?
Gold technical outlook
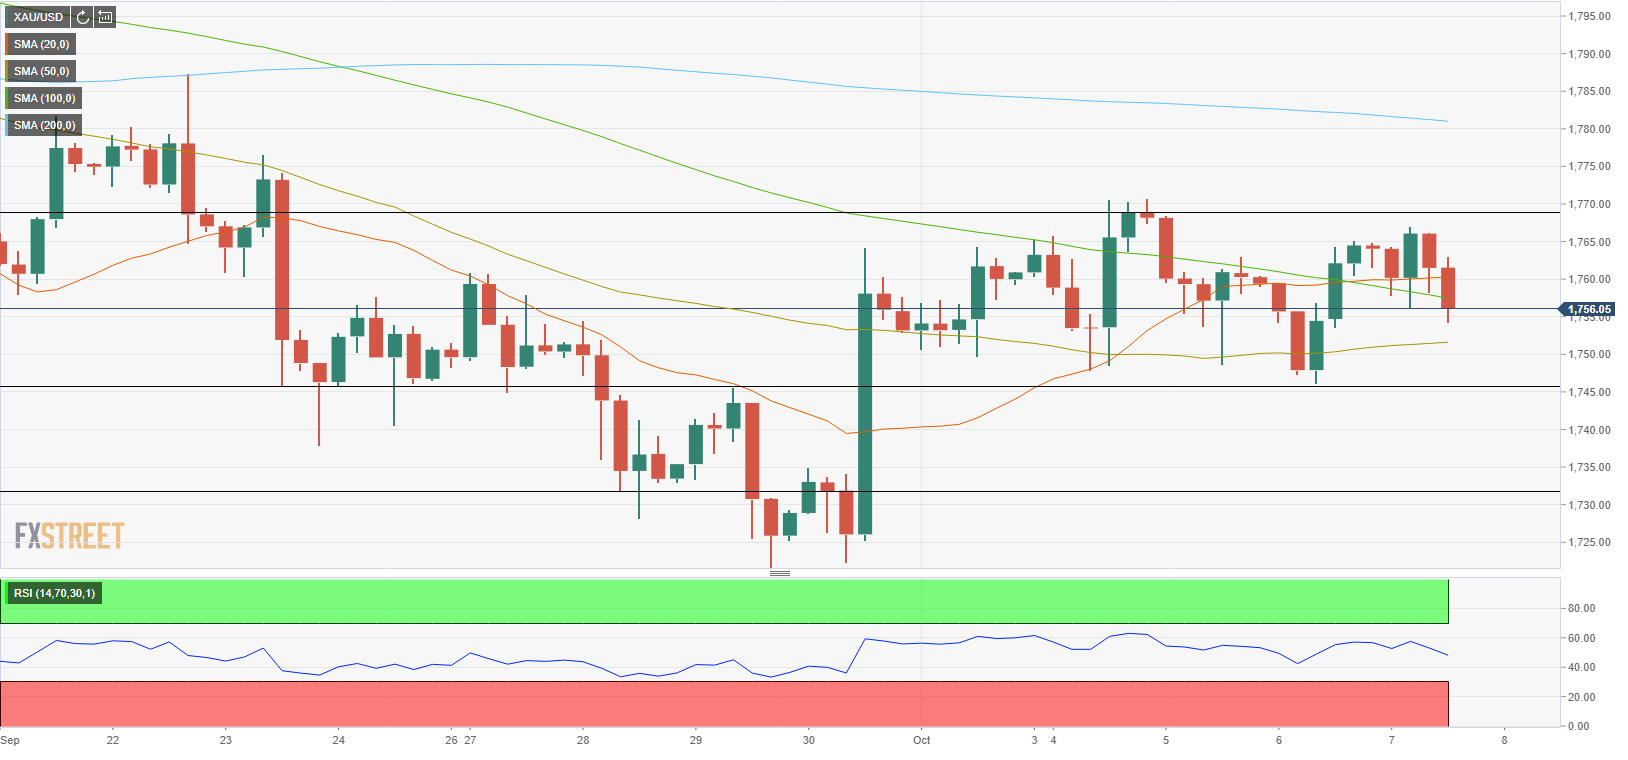
On the four-hour chart, the Relative Strength Index (RSI) indicator retreated below 50, suggesting that the buyers are struggling to remain in control of gold's action in the near term. On the downside, the initial support is located at $1,750 (50-period SMA) ahead of $1,745 (static level). A daily close below the latter could open the door for additional losses toward the next static support at $1,730.
On the other hand, strong resistance seems to have formed around $1,770. In case buyers manage to turn that level into support, the 200-period SMA could be seen as the next target on the upside.
Author

Eren Sengezer
FXStreet
As an economist at heart, Eren Sengezer specializes in the assessment of the short-term and long-term impacts of macroeconomic data, central bank policies and political developments on financial assets.


