|

Gold Price Forecast: XAU/USD looks vulnerable above $1,930 US yields seem well-supported

  • Gold price is expected to extend its downside journey below $1,930.00 ahead of Fed Powell’s testimony.
  • Investors are eager to know whether Fed Powell would choose a 50 bps rate hike or a data-dependent approach.
  • Gold price is on the edge of the horizontal support of the Descending Triangle pattern.

Gold price (XAU/USD) has concluded its less-confident pullback move to near $1,940.00 in the European session. The precious metal is expected to show further downside below $1930.00 as US Treasury yields have shown resilience ahead of Federal Reserve (Fed) chair Jerome Powell’s testimony.

S&P500 futures have turned flat after choppy moves as investors have sidelined ahead of Fed Powell’s testimony. The US Dollar Index (DXY) is showing topsy-turvy moves around 102.60. A volatile action is anticipated from the USD Index as the street is mixed in Fed’s 50 basis points (bps) interest rate hike vs. data-dependent approach. Contrary to the choppy USD Index, US Treasury yields look firmer. The 10-year US Treasury yields are holding above 3.74%.

Going forward, the entire focus will be on Jerome Powell's words. Economists at ING believe the first week of July is when we’ll get the most important set of data releases in the United States, so Powell’s words can determine whether DXY will end the quarter above or below the 102.00 mark.

Later this week, US weekly jobless claims data will remain in focus. The US Department of Labor has reported higher-than-anticipated first-timer jobless claims straight for the past three weeks. Further jump in claims would convey that labor market conditions are easing further.

Gold technical analysis

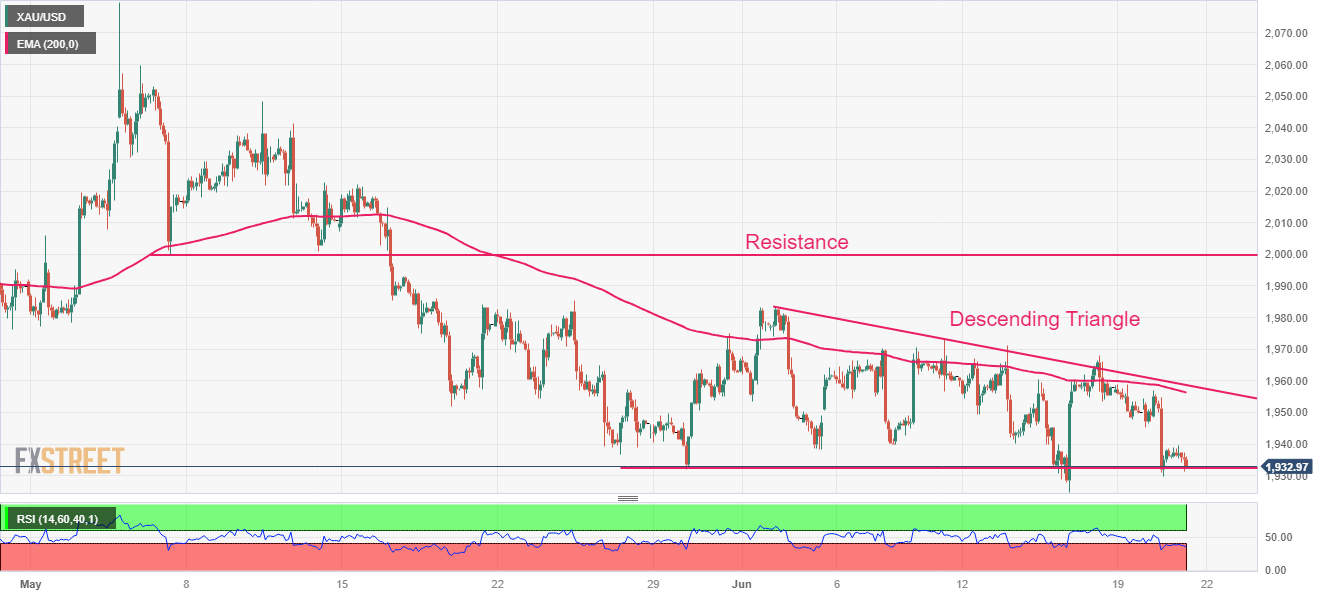
Gold price is on edge of the horizontal support of the Descending Triangle chart pattern formed on a two-hour scale, which is placed from May 30 low at $1,932.12. The downward-sloping trendline of the aforementioned chart pattern is plotted from June 02 high at $1,983.00. The 200-period Exponential Moving Average (EMA) at $1,958.84 is acting as a barricade for the Gold bulls. Horizontal resistance is plotted from May 05 low around $2,000.00.

The Relative Strength Index (RSI) (14) has slipped into the bearish range of 20.00-40.00, which indicates that the downside momentum has been triggered.

Gold two-hour chart

XAU/USD

Overview
Today last price1933.41
Today Daily Change-2.99
Today Daily Change %-0.15
Today daily open1936.4
 
Trends
Daily SMA201953.76
Daily SMA501983.15
Daily SMA1001942.45
Daily SMA2001849.86
 
Levels
Previous Daily High1956.86
Previous Daily Low1929.82
Previous Weekly High1971.01
Previous Weekly Low1924.85
Previous Monthly High2079.76
Previous Monthly Low1932.12
Daily Fibonacci 38.2%1940.15
Daily Fibonacci 61.8%1946.53
Daily Pivot Point S11925.19
Daily Pivot Point S21913.99
Daily Pivot Point S31898.15
Daily Pivot Point R11952.23
Daily Pivot Point R21968.07
Daily Pivot Point R31979.27

Author

Sagar Dua

Sagar Dua

FXStreet

Sagar Dua is associated with the financial markets from his college days. Along with pursuing post-graduation in Commerce in 2014, he started his markets training with chart analysis.

More from Sagar Dua
Share:

Markets move fast. We move first.

Orange Juice Newsletter brings you expert driven insights - not headlines. Every day on your inbox.

By subscribing you agree to our Terms and conditions.

Editor's Picks

EUR/USD recovers to 1.1750 region as 2025 draws to a close

Following the bearish action seen in the European session on Wednesday, EUR/USD regains its traction and recovery to the 1.1750 region. Nevertheless, the pair's volatility remains low as trading conditions thin out on the last day of the year.

GBP/USD stays weak near 1.3450 on modest USD recovery

GBP/USD remains under modest beairsh pressure and fluctuates at around 1.3450 on Wednesday. The US Dollar finds fresh demand due to the end-of-the-year position adjustments, weighing on the pair amid the pre-New Year trading lull. 

Gold retreats to $4,300 area, looks to post monthly gains

Gold stays on the back foot on the last day of 2025 and trades near $4,300, possibly pressured by profit-taking and position adjustments. Nevertheless, XAU/USD remains on track to post gains for December and extend its winning streak into a fifth consecutive month.

Bitcoin, Ethereum and XRP prepare for a potential New Year rebound

Bitcoin, Ethereum, and Ripple are holding steady on Wednesday after recording minor gains on the previous day. Technically, Bitcoin could extend gains within a triangle pattern while Ethereum and Ripple face critical overhead resistance. 

Economic outlook 2026-2027 in advanced countries: Solidity test

After a year marked by global economic resilience and ending on a note of optimism, 2026 looks promising and could be a year of solid economic performance. In our baseline scenario, we expect most of the supportive factors at work in 2025 to continue to play a role in 2026.

Crypto market outlook for 2026

Year 2025 was volatile, as crypto often is.  Among positive catalysts were favourable regulatory changes in the U.S., rise of Digital Asset Treasuries (DAT), adoption of AI and tokenization of Real-World-Assets (RWA).