Gold Price Forecast: XAU/USD retreats towards $1,800 as US dollar tracks strong yields
- Gold remains firmer around intraday high after a bullish candlestick formation.
- US Treasury yields refresh multi-day top as bond/equities’ trading resume following MLK Day off.
- DXY struggles to extend two-day uptrend amid mixed concerns over Fed’s next moves, Omicron.
- Gold Price Forecast: Hovering around $1,820 in a quiet start to the week

Update: Gold (XAU/USD) takes offers to reverse early Asian session gains while declining to $1,817 during the initial European morning on Tuesday.
The metal’s latest declines could be linked to the US dollar’s extension of the previous two-day upside, backed by the firmer US Treasury yields.
It’s worth noting that the US 10-year and 5-year Treasury yields refresh two-year highs while the 2-year bond coupon jumps to the February 2020 levels at the latest. Also portraying the risk-off mood is the S&P 500 Futures drop, 0.37% by the press time.
Behind the moves could be the market’s indecision over the Fed’s next move considering hawkish Fedspeak and softer US data, as well as Omicron concerns.
That said, US NY Empire State Manufacturing Index for January and NAHB Housing Market Index will decorate the calendar for the day while the next week’s Federal Open Market Committee (FOMC) meeting becomes the key.
End of update.
Gold (XAU/USD) prices stay on the front foot near intraday high of $1,820.31 during Tuesday’s Asian session.
The yellow metal portrayed a sluggish start to the week while marking a Doji candlestick on Monday following the two-day downside. The trend reversal suggests candlestick joins mixed concerns over the Fed’s next move and the South African covid variant, namely Omicron, to underpin the latest upside of the gold prices.
In doing so, the riskier asset ignores firmer US Treasury yields while tracking mildly bid S&P 500 Futures.
That said, the US 10-year and 5-year Treasury yields rose to the highest in two years while 2-year coupon jump to the February 2020 levels during the week-start move. On the other hand, S&P 500 Futures rise 0.12% intraday by the press time.
US Treasury yields seem to react to the latest hawkish comment from Federal Reserve Bank of San Francisco President Mary Daly and New York Fed President John Williams, published on Friday, ahead of next week’s Federal Open Market Committee (FOMC) meeting. In doing so, the bond coupons pay a little heed to the softer prints of the US Retail Sales for December and Michigan Consumer Sentiment Index for January.
It should be noted that Omicron concerns flash mixed signals with rising cases in China and Japan signaling more virus-led activity restrictions while softer numbers in the West placate market players. It should be noted that Tokyo and the other 10 Japanese prefectures are at the risk of witnessing quasi-emergency while China’s Tianjin threatens a stop all foreign mails due to covid.
Elsewhere, North Korea’s missile testing and the Sino-American tussles also challenge the market sentiment but fails of late.
Looking forward, Bank of Japan (BOJ) monetary policy and the UK jobs report will join updates concerning Omicron and the chatters suggesting China’s likely rate cut, not to forget talks of Fed’s next moves, to direct short-term market moves.
Technical analysis
Monday’s Doji candlestick joins firmer RSI and bullish MACD signals to keep gold buyers hopeful during Tuesday’s Asian session.
However, a clear upside break of the 61.8% Fibonacci retracement (Fibo.) of November-December 2021 downside, around $1,830, becomes necessary for the gold buyers to retake control. It’s worth noting that tops marked during July and September, around $1,834, act as a validation point for the commodity’s further rally.
Following that, the run-up could aim for the multiple lows marked during mid-November around $1,850 ahead of the challenging latest 2021 peak surrounding $1,877.
Alternatively, pullback moves may aim for the 50% and 38.2% Fibo. levels, respectively near $1,815 and $1,800 threshold.
Though, a convergence of the 100-DMA and an ascending support line from December 15, around $1,793, becomes a strong support for the gold sellers to watch afterward.
Overall, gold buyers brace for the short-term key hurdle to the north, backed by firmer oscillators and candlestick formation.
Gold: Daily chart
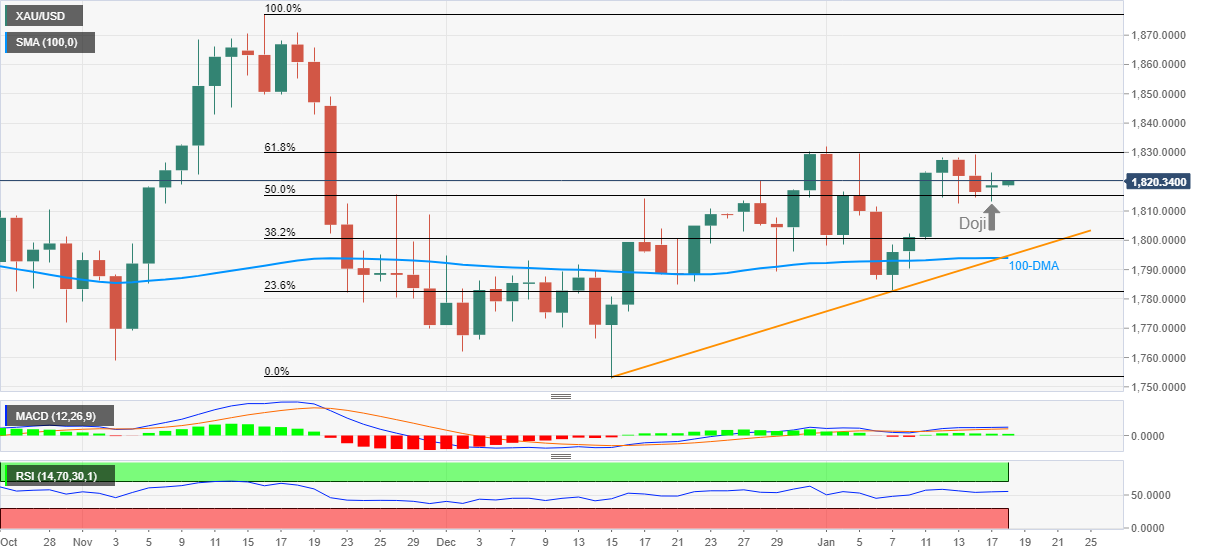
Trend: Further upside expected
Author

Anil Panchal
FXStreet
Anil Panchal has nearly 15 years of experience in tracking financial markets. With a keen interest in macroeconomics, Anil aptly tracks global news/updates and stays well-informed about the global financial moves and their implications.


