|

Gold Price Forecast: XAU/USD juggles above $1,950 as risk-on mood loses momentum ahead of US NFP

  • Gold price is facing barricades in extending range towards the north as USD Index is attempting a cushion around 100.50.
  • Analysts at the National Bank of Canada anticipate a policy change by the FOMC in the first quarter of 2023.
  • Going forward, the US NFP data will be of utmost importance.

Gold price (XAU/USD) is displaying back-and-forth moves in the early London session after a breathtaking rally above the crucial resistance of $1,950.00. The precious metal has turned sideways as the US Dollar Index (DXY) is building a cushion around 100.50. The upside bias is still favored as a smaller interest rate hike by the Federal Reserve (Fed) has pushed the USD Index into a negative trajectory.

Economists at the National Bank of Canada believe “It would be a mistake for the Fed to persist in raising its key rate well beyond the current level and holding it there for an extended period if inflation continues to surprise on the downside.” Therefore a policy change from the FOMC in the first quarter of 2023 is anticipated, which would set the stage for a more prolonged decline.

Meanwhile, S&P500 futures are holding their morning gains confidently, portraying that the risk appetite theme is extremely solid. However, the 10-year US Treasury yields have scaled firmly above 3.42%.

After the Fed’s policy-inspired volatility, investors are shifting their focus toward the release of the United States Nonfarm Payrolls (NFP) (Jan) data, which will release on Friday. As per the consensus, the US economy has added fresh 185K jobs in January vs. the prior addition of 223K. The Unemployment Rate is seen higher at 3.6%. Also, the Average Hourly Earnings are expected to accelerate to 4.9% from the former release of 4.6%.

Gold technical analysis

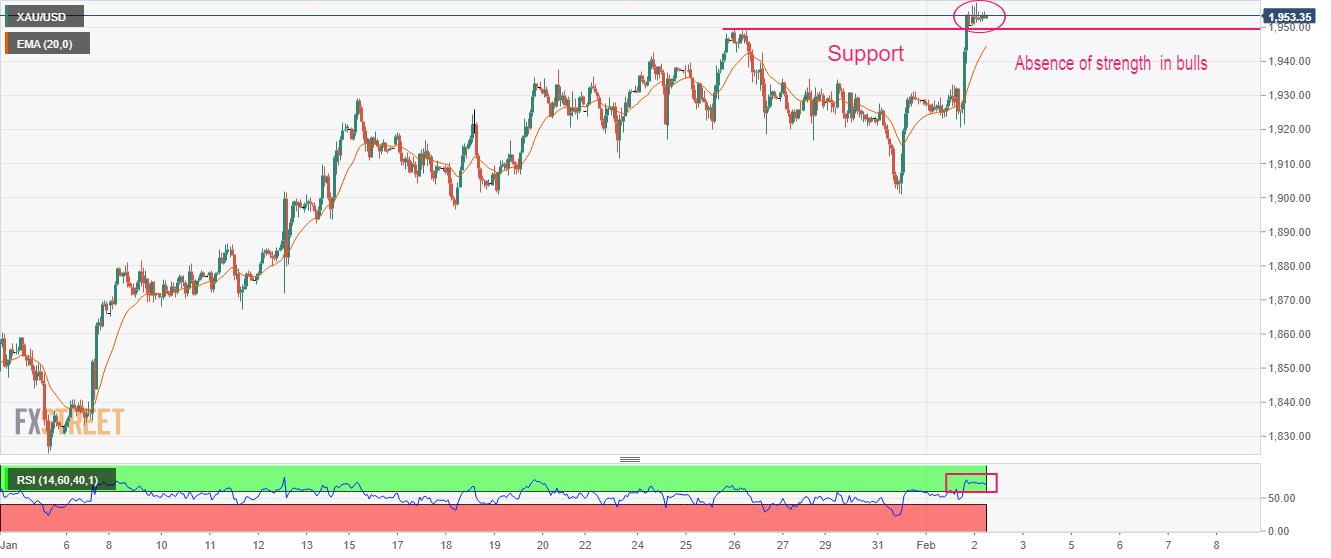
The formation of selling wicks by the Gold price after surpassing January 26 high at $1,949.26 is hinting at the presence of significant offers at elevated levels. It looks like the Gold bulls lack strength for a fresh upside. The 20-period Exponential Moving Average (EMA) at $1,945.00 is still aiming higher, which indicates that the upside trend has not halted yet.

Also, the Relative Strength Index (RSI) is showing signs of an overbought situation, which could result in a minor correction ahead.

Gold hourly chart

XAU/USD

Overview
Today last price1952.65
Today Daily Change-0.91
Today Daily Change %-0.05
Today daily open1953.56
 
Trends
Daily SMA201910.49
Daily SMA501840.72
Daily SMA1001762.09
Daily SMA2001776.05
 
Levels
Previous Daily High1953.6
Previous Daily Low1920.61
Previous Weekly High1949.27
Previous Weekly Low1911.45
Previous Monthly High1949.27
Previous Monthly Low1823.76
Daily Fibonacci 38.2%1941
Daily Fibonacci 61.8%1933.21
Daily Pivot Point S11931.58
Daily Pivot Point S21909.6
Daily Pivot Point S31898.59
Daily Pivot Point R11964.57
Daily Pivot Point R21975.58
Daily Pivot Point R31997.56

Author

Sagar Dua

Sagar Dua

FXStreet

Sagar Dua is associated with the financial markets from his college days. Along with pursuing post-graduation in Commerce in 2014, he started his markets training with chart analysis.

More from Sagar Dua
Share:

Editor's Picks

GBP/USD appears well offered near 1.3160

GBP/USD builds on Tuesday’s losses, although it now manages to pick up some pace and bounce off earlier multi-month troughs near 1.3140. The Greenback’s solid performance and continued political turmoil in the UK are keeping Cable under persistent pressure, with little sign of a meaningful recovery.

EUR/USD rebounds from lows, back to 1.1360

After bottoming out near 1.1320, EUR/USD gathers some traction and reclaims the 1.1350-1.1360 band as the NA session draws to a close on Wednesday. The pair’s drop to multi-month lows comes in response to the continuous leg higher in the US Dollar, which remains propped up by hawkish Fed expectations and uncertainty over the outcome of US-Iran peace negotiations.

Gold pressured near fresh 2026 lows

Gold accelerates its decline and gyrates around the key $4,000 mark per troy ounce on Wednesday, its lowest level since November 2025. In the meantime, tighter-for-longer Fed expectations and a broadly firmer US Dollar continue to weigh on the yellow metal, while uncertainty surrounding a potential US-Iran peace agreement has done little to revive demand for the safe haven space.

XRP nears key support as Fed hike risks suppress demand
Ripple (XRP) continues to face significant selling pressure, trading around $1.05 at the time of writing on Wednesday. This decline mirrors the broader weakness in the crypto market, exacerbated by mounting macroeconomic headwinds and persistent geopolitical uncertainties.
US-Iran talks: The next 60 days will decide where Oil prices go next
Oil markets received some encouraging news after weeks of rising tensions in the Middle East. But let’s not get ahead of ourselves: we’re far from victory, and markets just seem to have priced out the worst-case scenario. The US and Iran have reportedly made "substantive progress" in talks in Switzerland and agreed on a framework for working toward a broader deal within 60 days.
Regime change: Inside Kevin Warsh's first move to make the Fed unreadable on purpose

The rate did not move. That was the least interesting thing about Kevin Warsh's first meeting in charge of the Fed. The FOMC held its benchmark at 3.50%-3.75% for the fourth straight meeting, exactly as priced, and then the new chair used his first press conference to dismantle the machinery the market has leaned on for a decade.