|

Gold Price Forecast: XAU/USD glistens amidst geopolitical tensions to test 20-DMA

  • Gold price to remain bid if geopolitical unrest escalates.
  • Federal Reserve officials adopt a cautious and nimble approach toward mitigating high inflation.
  • XAU/USD’s traders eye US inflation data and Fed commentary.

Gold price hit a weekly high of $1857.69, with the financial markets being hit by geopolitical unrest due to the conflict between Israel and Palestinian Islamist group Hamas during the weekend and bolstering the appetite for Gold’s safe-haven status. XAU/USD is trading at $1856.63, gains more than 1.30%, after printing a daily low of $1843.80.

Safe-haven appeal of Gold bolstered by Israel-Hamas fight and dovish Fed remarks

Investors' mood remains downbeat as the fight continues. US Federal Reserve (Fed) officials crossed newswires, led by Vice-Chair Philip Jefferson and the Dallas Fed President Lorie Logan.

Fed Vice-Chair Jefferson said that current monetary policy is restrictive, though emphasized “we need to do our work” to bring inflation down. He added they need to be nimble “with regards to what is happening in the economy.” Earlier, Dallas Fed President Logan commented she is focused on inflation risks and added they have more work to do. She stated the surprising strength of the economy creates upside risks on inflation.

Another reason that is sponsoring a leg-up in Gold prices is the drop in US Treasury bond yields, particularly real yields. the yield in the US 10-year Treasury Inflation-Protected Securities (TIPS), remains at 2.47% with the US bond markets closed, while the 10-year yield plummets 15-baiss points from 4.797% to 4.657%.

Aside from this, the US economic agenda was absent in the observance of Columbus Day. Ahead in the week, US inflation data on the producer and the consumer side would be crucial in dictating the US Federal Reserve’s next move.

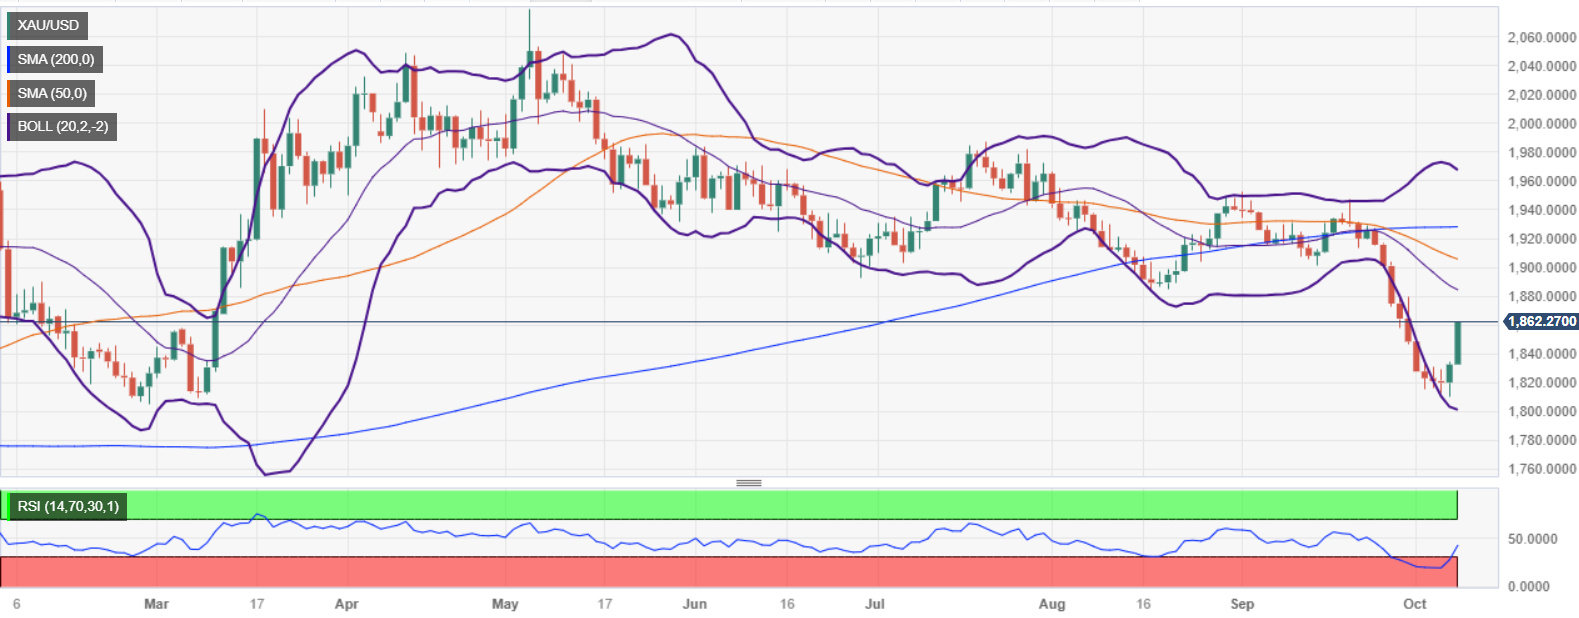
Gold Price Analysis (XAU/USD): Technical outlook

After bottoming at around $1810.00, the XAU/USD has resumed its uptrend due to risk aversion, with buyers eyeing the next resistance level, the 20-day moving average (DMA) at $1884.00. A breach of the latter will expose the 50-DMA at $1905.52, followed by the 100-DMA at $1925.73 and the 200-DMA at $1928.75. Conversely, failure to crack the 20-DMA would open the door for a pullback. First support would be the last week’s low of $1810, followed by the $1800.00 figure.

XAU/USD

Overview
Today last price1860.32
Today Daily Change27.70
Today Daily Change %1.51
Today daily open1832.62
 
Trends
Daily SMA201887.46
Daily SMA501907.84
Daily SMA1001927.22
Daily SMA2001928.07
 
Levels
Previous Daily High1834.94
Previous Daily Low1810.51
Previous Weekly High1849.16
Previous Weekly Low1810.51
Previous Monthly High1953.01
Previous Monthly Low1846.37
Daily Fibonacci 38.2%1825.61
Daily Fibonacci 61.8%1819.84
Daily Pivot Point S11817.11
Daily Pivot Point S21801.59
Daily Pivot Point S31792.68
Daily Pivot Point R11841.54
Daily Pivot Point R21850.45
Daily Pivot Point R31865.97

Author

Christian Borjon Valencia

Christian Borjon began his career as a retail trader in 2010, mainly focused on technical analysis and strategies around it. He started as a swing trader, as he used to work in another industry unrelated to the financial markets.

More from Christian Borjon Valencia
Share:

Markets move fast. We move first.

Orange Juice Newsletter brings you expert driven insights - not headlines. Every day on your inbox.

By subscribing you agree to our Terms and conditions.

Editor's Picks

EUR/USD bears await break below 100-day SMA support near 1.1665 area

The EUR/USD pair attracts heavy selling for the second straight day and dives to a nearly four-week trough, around the 1.1670 region, during the Asian session on Monday. Bearish traders now await a sustained break below the 100-day Simple Moving Average before positioning for an extension of the recent pullback from a three-month top, or levels just above the 1.1800 mark touched on December 24.

GBP/USD falls toward 1.3400 near 50-day EMA

GBP/USD extends its losses for the second successive session, trading around 1.3420 during the Asian hours on Monday. The technical analysis of the daily chart indicates that the 14-day Relative Strength Index at 53 has eased from near overbought, indicating that momentum has cooled while remaining above the midline. RSI holds above 50, keeping a modest bullish bias.

Gold on fire at the start of the week on US-Venezuela tensions

Gold regains upside traction early Monday as flight to safety prevails on Venezuela turmoil. The US Dollar finds strong haven demand, caps Gold’s upside as focus shifts to US jobs data. Gold’s daily technical setup suggests that more upside remains in the offing.

Bulls firmly in control as Bitcoin breaks $93K, Ethereum and Ripple extend gains

Bitcoin, Ethereum, and Ripple extended their rallies on Monday, gaining more than 4%, 6%, and 12%, respectively, in the previous week. The top three cryptocurrencies by market capitalization could continue to outperform, with bulls in control of the momentum.

Economic outlook 2026-2027 in advanced countries: Solidity test

After a year marked by global economic resilience and ending on a note of optimism, 2026 looks promising and could be a year of solid economic performance. In our baseline scenario, we expect most of the supportive factors at work in 2025 to continue to play a role in 2026.

Meme Coins Price Prediction: Dogecoin, Shiba Inu, Pepe rally on Venezuela’s shadow BTC reserve

Meme coins such as Dogecoin, Shiba Inu, and Pepe are leading the cryptocurrency market rally driven by the US cross-border operation to capture Venezuelan President Nicolás Maduro. Dogecoin extends its gain for the fifth consecutive day while SHIB and PEPE take a pause.