- Gold price has climbed strongly to $1,950.00 as US inflation has softened more than expectations.
- The US Dollar Index has plunged as the Fed would have the luxury of skipping interest rates further.
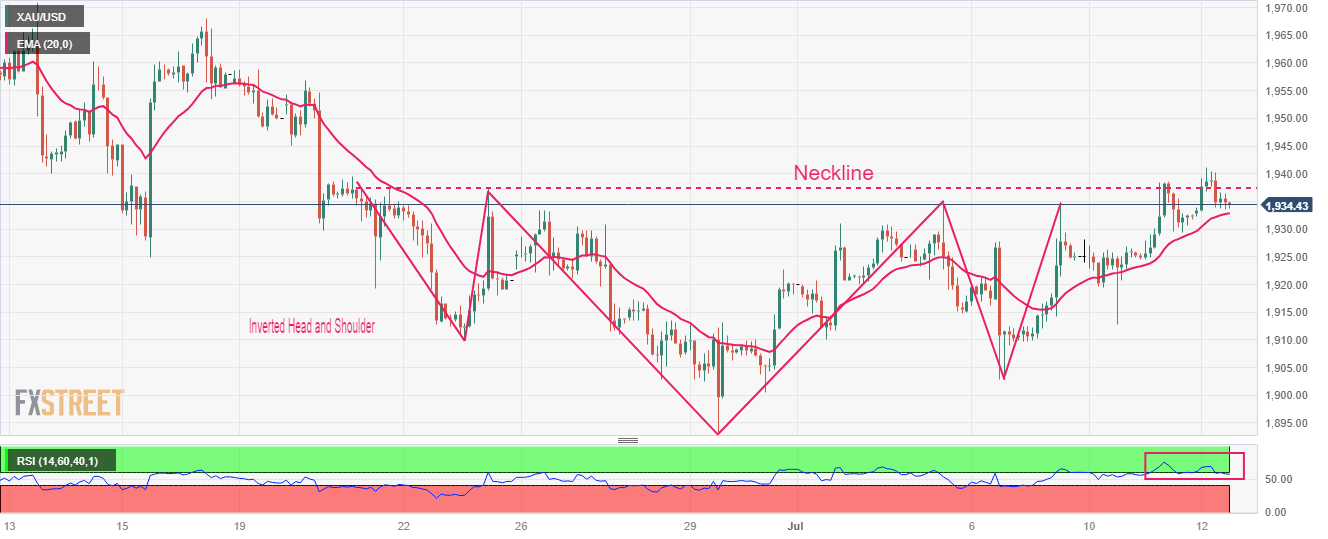
- Gold price is expected to deliver an Inverted H&S breakout after surpassing the neckline plotted around $1,940.00.
Gold price (XAU/USD) has displayed a stellar run as the United States Bureau of Labor Statistics has reported softer-than-expected June Consumer Price Index (CPI) data. The monthly headline and core inflation has reported a pace of 0.2% while investors were anticipating a higher velocity of 0.3%.
Annualized headline CPI has softened to 3.0% vs. the consensus of 3.1% and the former release of 4.0%. While annualized inflation has decelerated to 4.8% against the estimates of 5.0% and the prior release of 5.3%. More-than-anticipated cool-down in inflationary pressures would trim expectations of an interest rate hike by the Federal Reserve (Fed) in its July monetary policy meeting.
Meanwhile, S&P500 futures have jumped strongly as soft inflation figures have eased fears of a recession in the United States. The US Dollar Index (DXY) has demonstrated a vertical fall to near the crucial support of 101.00. The yields offered on 10-year US Treasury bonds have sharply dropped to 3.88%.
Going forward, investors will focus on Thursday’s Producer Price Index (PPI) data. As per the consensus, monthly PPI is expected to register a pace of 0.2% vs. a contraction of 0.3%. It looks like a mild recovery in gasoline prices has propelled factory gate prices.
Gold technical analysis
Gold price is gathering strength to deliver a breakout of the Inverted Head and Shoulder chart pattern formed on a two-hour scale. A breakout of the aforementioned chart pattern will result in a bullish reversal. The neckline of the chart pattern is plotted around June 21 high at $1,940.00.
The 20-period Exponential Moving Average (EMA) at $1,932.90 is providing cushion to the Gold bulls.
Meanwhile, the Relative Strength Index (RSI) (14) has confidently shifted into the bullish range of 60.00-80.00, which indicates that the bullish momentum has been triggered.
Gold two-hour chart
Information on these pages contains forward-looking statements that involve risks and uncertainties. Markets and instruments profiled on this page are for informational purposes only and should not in any way come across as a recommendation to buy or sell in these assets. You should do your own thorough research before making any investment decisions. FXStreet does not in any way guarantee that this information is free from mistakes, errors, or material misstatements. It also does not guarantee that this information is of a timely nature. Investing in Open Markets involves a great deal of risk, including the loss of all or a portion of your investment, as well as emotional distress. All risks, losses and costs associated with investing, including total loss of principal, are your responsibility. The views and opinions expressed in this article are those of the authors and do not necessarily reflect the official policy or position of FXStreet nor its advertisers. The author will not be held responsible for information that is found at the end of links posted on this page.
If not otherwise explicitly mentioned in the body of the article, at the time of writing, the author has no position in any stock mentioned in this article and no business relationship with any company mentioned. The author has not received compensation for writing this article, other than from FXStreet.
FXStreet and the author do not provide personalized recommendations. The author makes no representations as to the accuracy, completeness, or suitability of this information. FXStreet and the author will not be liable for any errors, omissions or any losses, injuries or damages arising from this information and its display or use. Errors and omissions excepted.
The author and FXStreet are not registered investment advisors and nothing in this article is intended to be investment advice.
Recommended content
Editors’ Picks
EUR/USD Weekly Forecast: Sellers gain confidence alongside the Fed Premium
GBP/USD Weekly Forecast: Pound Sterling stays vulnerable ahead of UK inflation data Premium
The Pound Sterling (GBP) booked the second straight weekly loss against the US Dollar (USD), sending the GBP/USD pair to the lowest level in a month below 1.3050.
Gold Weekly Forecast: XAU/USD holds above key support area after bearish action to start week Premium
Gold (XAU/USD) declined sharply in the first half of the week but regained its traction after coming within a touching distance of $2,600.
Bitcoin Weekly Forecast: Will BTC decline further?
Bitcoin’s (BTC) price fell over 6% at some point this week until Thursday, extending losses for a second consecutive week, as it faced rejection from a key resistance barrier.
RBA widely expected to keep key interest rate unchanged amid persisting price pressures
The Reserve Bank of Australia is likely to continue bucking the trend adopted by major central banks of the dovish policy pivot, opting to maintain the policy for the seventh consecutive meeting on Tuesday.
Five best Forex brokers in 2024
VERIFIED Choosing the best Forex broker in 2024 requires careful consideration of certain essential factors. With the wide array of options available, it is crucial to find a broker that aligns with your trading style, experience level, and financial goals.