Gold Price Forecast: XAU/USD eyes $1,900 and US CPI on renewed upside – Confluence Detector
- Gold price looks north, as US Dollar licks its wounds amid sluggish Treasury yields.
- Markets turn cautious amid expectations of a softer US CPI report.
- Gold bulls stay hopeful whilst above critical $1,825 support, eye $1,850 again.

Gold price is holding near eight-month highs, as bulls seek another to take on the $1,900 barrier ahead of the all-important US Consumer Price Index (CPI) data release. The US Dollar remains vulnerable amid expectations of a softer US CPI print, which ramp up bets for a dovish Federal Reserve (Fed) pivot later this year. Markets are pricing the Fed to slow its pace of tightening amid cooling inflation and a tight labor market, with about an 80% probability of a 25 basis points (bps) rate hike seen at the start of the next month. Gold price is also benefiting from the underperformance in the US Treasury bond yields across the curve. Despite the latest hawkish commentary from the Fed officials, investors refuse to give up on hopes that the Fed will turn dovish on its policy stance. Besides, risk trends will also play a pivotal role in the Gold price action in the day ahead.
Also read: US December CPI Preview: EUR/USD and USD/JPY are pairs to watch
Gold Price: Key levels to watch
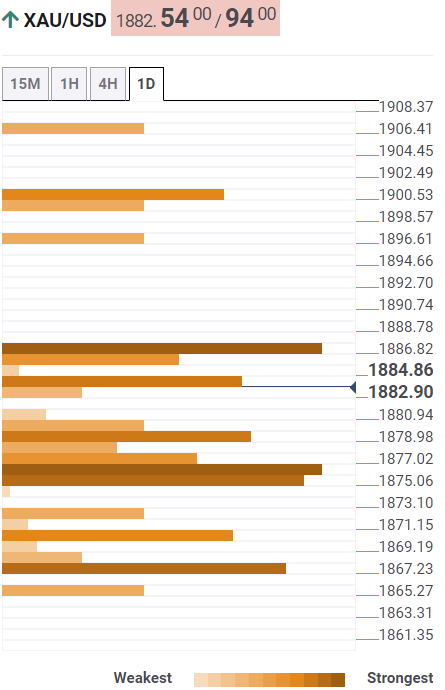
The Technical Confluence Detector shows that the gold price is gathering pace to scale the critical resistance at around $1,885-$1,886, where the pivot point one-day R1 and Bollinger Band one-day Upper merge.
A fresh upswing could be triggered on a firm break above the latter, opening doors toward the pivot point one-day R2 at $1,896. Further up, the $1,900 threshold could be put to test should Gold bulls flex their muscles. That level is the convergence of the pivot point one-week R2 and Fibonacci 161.8% one-day.
Alternatively, a dense cluster of healthy support levels is aligned between $1,879-$1,875, which could guard against the downside in Gold price. At that demand area, the Fibonacci 38.2% one-day, pivot point one-month R2 and SMA10 four-hour intersect.
The next downside target is seen at the previous week’s high of $1,870, below which Gold sellers will target the previous day’s low at $1,867.
Here is how it looks on the tool
About Technical Confluences Detector
The TCD (Technical Confluences Detector) is a tool to locate and point out those price levels where there is a congestion of indicators, moving averages, Fibonacci levels, Pivot Points, etc. If you are a short-term trader, you will find entry points for counter-trend strategies and hunt a few points at a time. If you are a medium-to-long-term trader, this tool will allow you to know in advance the price levels where a medium-to-long-term trend may stop and rest, where to unwind positions, or where to increase your position size.
Author

Dhwani Mehta
FXStreet
Residing in Mumbai (India), Dhwani is a Senior Analyst and Manager of the Asian session at FXStreet. She has over 10 years of experience in analyzing and covering the global financial markets, with specialization in Forex and commodities markets.


