Gold Price Forecast: XAU/USD eases below $1,850 as traders await US PMI, Fed’s Powell


  • Gold fades bounce off weekly low, takes offers to refresh intraday low.
  • Market sentiment dwindles after Fed’s Powell defends current monetary policy outlook.
  • Yields remain pressured, stock futures print mild losses amid lack of clarity.
  • Powell’s Testimony 2.0, US PMIs for June will be important to watch for fresh impulse.

Gold Price (XAU/USD) remains on the back foot, reversing the previous day’s rebound from the weekly low, as traders await fresh clues during Thursday’s Asian session. That said, the yellow metal renews intraday low around $1,835 by the press time.

Earlier in the day, Reuters said, “An early look at the state of the US job market in June from payroll provider UKG suggests some strengthening, even as the Federal Reserve lifts interest rates sharply and economists raise alarms over the likelihood of a recession.” The news seems to have exerted fresh downside pressure on gold prices. Furthermore, Reuters poll suggesting that the European Central Bank (ECB) will raise benchmark rate to 0.75%, from 0.0% currently, also weigh on the market's mood and gold prices.

That said, the precious metal’s latest losses could also be linked to the market’s reassessment of Fed Chair Jerome Powell’s Testimony on the bi-annual Monetary Policy Report, which took place on Wednesday. Federal Reserve (Fed) Chairman Jerome Powell’s justification for the recent rate hike, the biggest since 1994, managed to gain acceptance, at least during the first round of the Testimony on the bi-annual Monetary Policy Report. However, Powell’s rejection of the need for a heavy rate increase seemed to have favored the risk appetite and gold prices afterward, before the latest weakness.

On a different page, easing fears of aggressive central bank moves, mainly due to a reduction in the oil prices and recently downbeat US data, could also be linked to the XAU/USD’s previous rebound. That said, WTI crude oil prices dropped 0.85% to $103.50, down for the second consecutive day around the lowest levels in six weeks. The black gold’s latest weakness could be linked to the bearish weekly inventory data from the American Petroleum Institute (API). Additionally, talks that US President Joe Biden will announce gas tax relief by the end of the week also weighed on the oil prices.

Furthermore, the latest US figures concerning housing and activities have been softer for May, which in turn eases the pressure on the Fed to tame inflation.

Amid these plays, Wall Street managed to pare the day-start losses but ended Wednesday with mild losses whereas the US 10-year Treasury yields marked the biggest daily fall in a week by ending the day at around 3.16%, down two basis points near 3.14% by the press time. That said, the S&P 500 Futures drop 0.50% at the latest.

Looking forward, US S&P Global PMIs for June and the weekly Jobless Claims data will precede the second round of Fed Chair Jerome Powell’s Testimony to direct short-term gold price moves.

Technical analysis

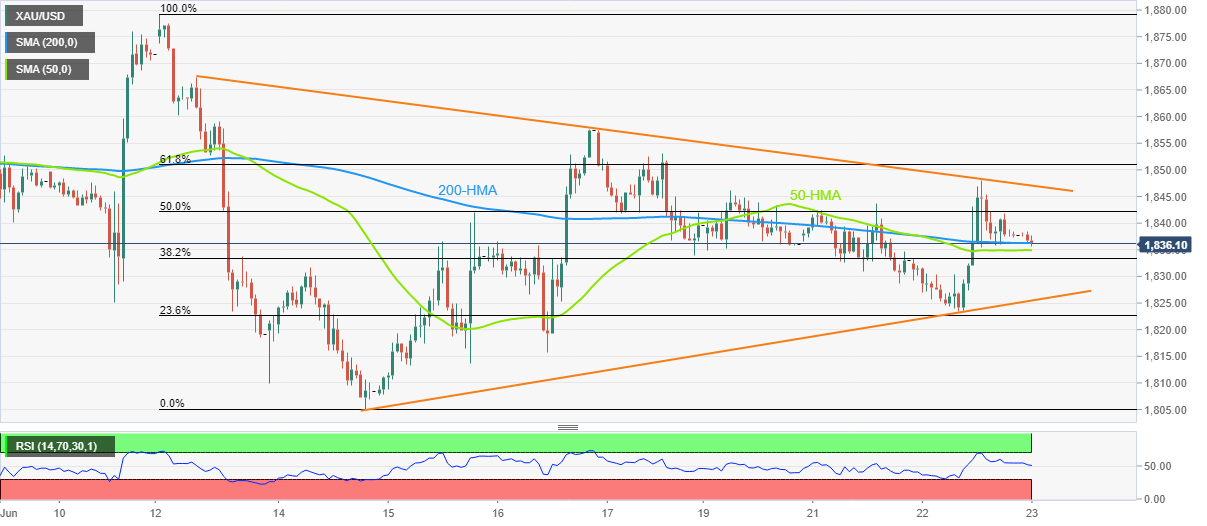
Gold extends pullback from an eight-day-old resistance line as sellers attack the key HMAs.

Given the RSI retreat from the overbought territory backing the metal’s latest weakness, the XAU/USD prices may decline below the immediate HMA confluence surrounding $1,835.

However, an upward sloping support line from June 14, near $1,825 by the press time, could challenge the quote’s short-term downside.

On the contrary, recovery moves need to cross the one-week-old trend line resistance, close to $1,848 at the latest, to recall the gold buyers.

Gold: Hourly chart

Trend: Further weakness expected

Additional important levels

Overview
Today last price 1835.58
Today Daily Change -2.16
Today Daily Change % -0.12%
Today daily open 1837.74
 
Trends
Daily SMA20 1844.76
Daily SMA50 1867.33
Daily SMA100 1891.58
Daily SMA200 1843.58
 
Levels
Previous Daily High 1847.95
Previous Daily Low 1823.43
Previous Weekly High 1879.26
Previous Weekly Low 1805.11
Previous Monthly High 1909.83
Previous Monthly Low 1786.94
Daily Fibonacci 38.2% 1838.58
Daily Fibonacci 61.8% 1832.8
Daily Pivot Point S1 1824.8
Daily Pivot Point S2 1811.85
Daily Pivot Point S3 1800.28
Daily Pivot Point R1 1849.32
Daily Pivot Point R2 1860.89
Daily Pivot Point R3 1873.84


Share: Feed news

Information on these pages contains forward-looking statements that involve risks and uncertainties. Markets and instruments profiled on this page are for informational purposes only and should not in any way come across as a recommendation to buy or sell in these assets. You should do your own thorough research before making any investment decisions. FXStreet does not in any way guarantee that this information is free from mistakes, errors, or material misstatements. It also does not guarantee that this information is of a timely nature. Investing in Open Markets involves a great deal of risk, including the loss of all or a portion of your investment, as well as emotional distress. All risks, losses and costs associated with investing, including total loss of principal, are your responsibility. The views and opinions expressed in this article are those of the authors and do not necessarily reflect the official policy or position of FXStreet nor its advertisers. The author will not be held responsible for information that is found at the end of links posted on this page.

If not otherwise explicitly mentioned in the body of the article, at the time of writing, the author has no position in any stock mentioned in this article and no business relationship with any company mentioned. The author has not received compensation for writing this article, other than from FXStreet.

FXStreet and the author do not provide personalized recommendations. The author makes no representations as to the accuracy, completeness, or suitability of this information. FXStreet and the author will not be liable for any errors, omissions or any losses, injuries or damages arising from this information and its display or use. Errors and omissions excepted.

The author and FXStreet are not registered investment advisors and nothing in this article is intended to be investment advice.

Recommended content


Recommended content

Editors’ Picks

AUD/USD risks a deeper drop in the short term

AUD/USD risks a deeper drop in the short term

AUD/USD rapidly left behind Wednesday’s decent advance and resumed its downward trend on the back of the intense buying pressure in the greenback, while mixed results from the domestic labour market report failed to lend support to AUD.

AUD/USD News

EUR/USD leaves the door open to a decline to 1.0600

EUR/USD leaves the door open to a decline to 1.0600

A decent comeback in the Greenback lured sellers back into the market, motivating EUR/USD to give away the earlier advance to weekly tops around 1.0690 and shift its attention to a potential revisit of the 1.0600 neighbourhood instead.

EUR/USD News

Gold is closely monitoring geopolitics

Gold is closely monitoring geopolitics

Gold trades in positive territory above $2,380 on Thursday. Although the benchmark 10-year US Treasury bond yield holds steady following upbeat US data, XAU/USD continues to stretch higher on growing fears over a deepening conflict in the Middle East.

Gold News

Bitcoin price shows strength as IMF attests to spread and intensity of BTC transactions ahead of halving

Bitcoin price shows strength as IMF attests to spread and intensity of BTC transactions ahead of halving

Bitcoin (BTC) price is borderline strong and weak with the brunt of the weakness being felt by altcoins. Regarding strength, it continues to close above the $60,000 threshold for seven weeks in a row.

Read more

Is the Biden administration trying to destroy the Dollar?

Is the Biden administration trying to destroy the Dollar?

Confidence in Western financial markets has already been shaken enough by the 20% devaluation of the dollar over the last few years. But now the European Commission wants to hand Ukraine $300 billion seized from Russia.

Read more

Forex MAJORS

Cryptocurrencies

Signatures