Gold Price Forecast: XAU/USD corrects below $1,660, upside looks likely ahead of US GDP data
- Gold prices have shifted into a corrective phase after failing to sustain above $1,660.00.
- Declining 10-year yields from a high of 4% have strengthened the risk-on impulse.
- An expectation of a slowdown in the current pace of hiking rates by the Fed has weakened the DXY.

Gold price (XAU/USD) is displaying a time correction move in Asia after a juggernaut rally from $1,620.00. The precious metal is declining gradually after failing to sustain above $1,660.00, however, the upside remains favored in a cheerful market mood. A decline in US Treasury yields brought a bumper rally in the risk-sensitive assets. The 10-year benchmark US Treasury yields fell sharply from 4% to around 3.7%.
The US dollar index (DXY) has witnessed a pullback move to near 113.00. However, the pullback move seems less confident and will conclude sooner. No doubt, the hawkish commentaries from Federal Reserve (Fed) policymakers should delight the DXY. But those commentaries are also highlighting the fact that the pace of hiking interest rates by the Fed will slow down in a short time. Fed’s current interest rates stand at 3-3.25% and bigger hikes are expected in the remaining 2022. This will leave a small room for deviation from the optimal rate of 4.6%.
Going forward, investors’ focus will remain on the US Gross Domestic Product (GDP), which will display the condition of the growth rate in economic activities. As per the consensus, the growth rate in the US economy has declined by 0.6% in the second quarter on an annualized basis. A weaker-than-expected release will strengthen the gold prices further.
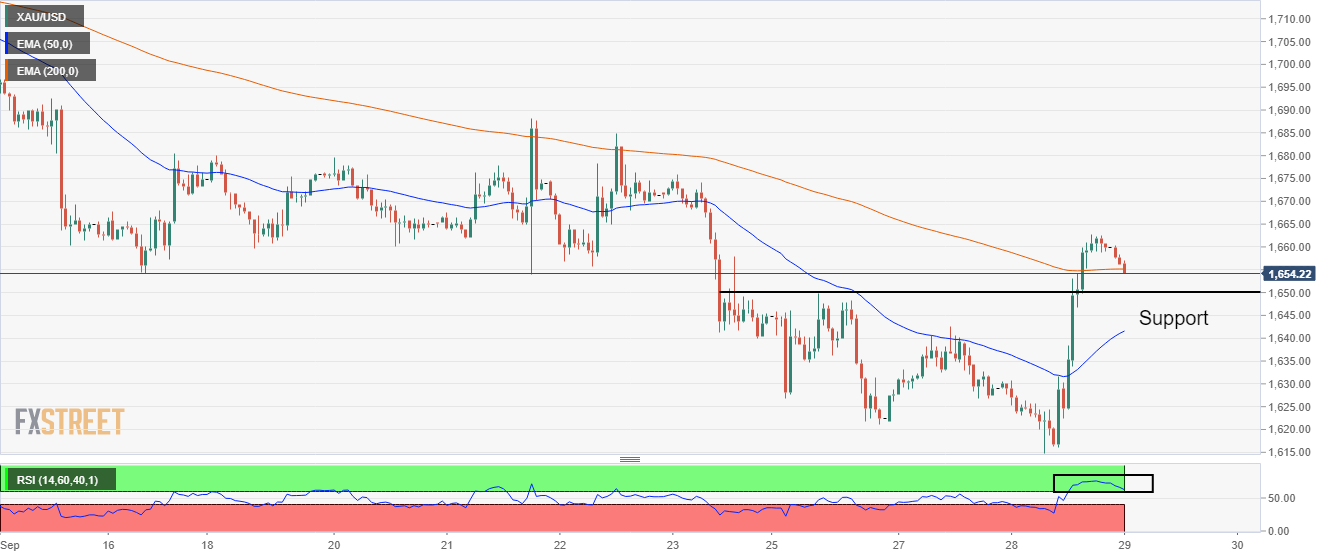
Gold technical analysis
Gold prices are declining towards the horizontal support placed from Monday’s high at $1,649.83 on an hourly scale. The precious metal is declining gradually, therefore, it is expected to capitalize on the above-mentioned horizontal support.
The yellow metal is holding above the 50-period Exponential Moving Average (EMA) at $1,641.58, which indicates that the short-term uptrend is intact. While it has slipped below the 200-EMA at $1,655.00 but is expected to recapture it sooner.
Meanwhile, the Relative Strength Index (RSI) (14) is oscillating in a bullish range of 60.00-80.00, which indicates more upside ahead. Also, the momentum oscillator may find support at 60.00.
Gold hourly chart
Author

Sagar Dua
FXStreet
Sagar Dua is associated with the financial markets from his college days. Along with pursuing post-graduation in Commerce in 2014, he started his markets training with chart analysis.


