|

Gold Price Forecast: XAU/USD continues to remain sideways around $2,050 as focus turns to US job data

  • Gold price is in a sideways auction around $2,050.00 ahead of the US Employment data.
  • The Fed is likely to restrict itself from raising rates further amid deepening US banking crisis, and slower growth rate.
  • Gold price is building a base near the demand zone plotted in a narrow range around $2,050.00.

Gold price (XAU/USD) is showing signs of volatility contraction around $2,050.00 in the Asian session. The precious metal is struggling to make a decisive move as investors are awaiting the release of the United States Nonfarm Payrolls (NFP) data for further action.

The US Dollar Index (DXY) is failing to find an intermediate cushion and is declining firmly. The USD Index has dropped to near 101.16 as the Federal Reserve (Fed) is likely to restrict itself from raising interest rates further amid deepening US banking crisis, slower growth rate, and easing US labor market conditions.

On Thursday, weekly Initial Jobless Claims for the week ending April 28 jumped to 242K vs. the consensus of 240K and the former release of 229K.

However, the street would get more clarity after the release of the US Nonfarm Payrolls (NFP) data. As per the consensus, the US labor market witnessed a fresh addition of 179K payrolls in April, which was lower than former additions of 236K. The catalyst that will hijack the attention of investors would be the Average Hourly Earnings data. The street is anticipating steady earnings numbers, however, a better-than-expected print would renew fears of recovery in inflationary pressures.

Apart from that any development on debt ceiling concerns would turn the USD Index extremely volatile.

Gold technical analysis

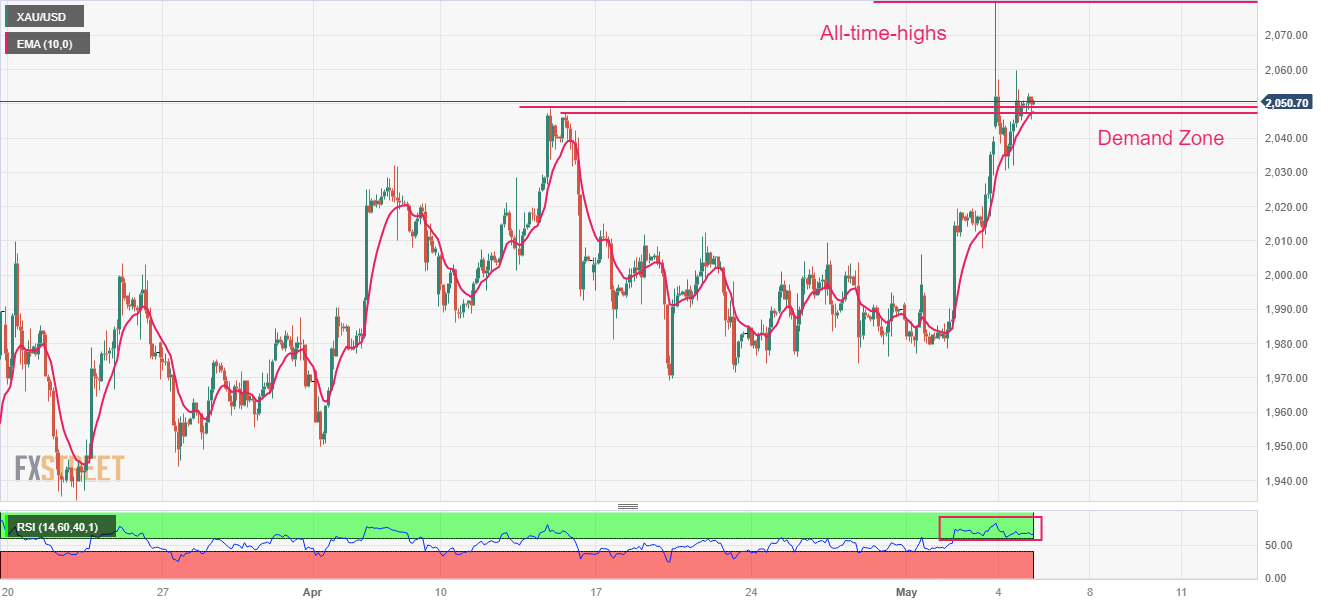
Gold price is building a base near the demand zone plotted in a narrow range around $2,050.00 on a two-hour scale. The precious metal fell sharply after printing an all-time high of $2,079.77. The 10-period Exponential Moving Average (EMA) at $2,047.00 is providing cushion to the Gold bulls.

Meanwhile, the Relative Strength Index (RSI) (14) is still oscillating in the bullish range of 60.00-80.00, indicating that the upside bias is holding momentum.

Gold two-hour chart

XAU/USD

Overview
Today last price2050.86
Today Daily Change0.62
Today Daily Change %0.03
Today daily open2050.24
 
Trends
Daily SMA202004.35
Daily SMA501948.9
Daily SMA1001906.48
Daily SMA2001813.36
 
Levels
Previous Daily High2079.76
Previous Daily Low2030.45
Previous Weekly High2009.41
Previous Weekly Low1974.13
Previous Monthly High2048.75
Previous Monthly Low1949.83
Daily Fibonacci 38.2%2060.92
Daily Fibonacci 61.8%2049.29
Daily Pivot Point S12027.21
Daily Pivot Point S22004.17
Daily Pivot Point S31977.9
Daily Pivot Point R12076.52
Daily Pivot Point R22102.79
Daily Pivot Point R32125.83

Author

Sagar Dua

Sagar Dua

FXStreet

Sagar Dua is associated with the financial markets from his college days. Along with pursuing post-graduation in Commerce in 2014, he started his markets training with chart analysis.

More from Sagar Dua
Share:

Markets move fast. We move first.

Orange Juice Newsletter brings you expert driven insights - not headlines. Every day on your inbox.

By subscribing you agree to our Terms and conditions.

Editor's Picks

EUR/USD bounces toward 1.1750 as US Dollar loses strength

EUR/USD returned to the 1.1750 price zone in the American session on Friday, despite falling Wall Street, which indicates risk aversion. Trading conditions remain thin following the New Year holiday and ahead of the weekend, with the focus shifting to US employment and European data scheduled for next week.

GBP/USD nears 1.3500, holds within familiar levels

After testing 1.3400 on the last day of 2025, GBP/USD managed to stage a rebound. Nevertheless, the pair finds it difficult to gather momentum and trades with modest intraday gains at around 1.3490 as market participants remain in holiday mood.

Gold trims intraday gains, approaches $4,300

Gold retreated sharply from the $4,400  area and trades flat for the day in the $4,320 price zone. Choppy trading conditions exacerbated the intraday decline, although XAU/USD bearish case is out of the picture, considering growing expectations for a dovish Fed and persistent geopolitical tensions.

Cardano gains early New Year momentum, bulls target falling wedge breakout

Cardano kicks off the New Year on a positive note and is extending gains, trading above $0.36 at the time of writing on Friday. Improving on-chain and derivatives data point to growing bullish interest, while the technical outlook keeps an upside breakout in focus.

Economic outlook 2026-2027 in advanced countries: Solidity test

After a year marked by global economic resilience and ending on a note of optimism, 2026 looks promising and could be a year of solid economic performance. In our baseline scenario, we expect most of the supportive factors at work in 2025 to continue to play a role in 2026.

Crypto market outlook for 2026

Year 2025 was volatile, as crypto often is.  Among positive catalysts were favourable regulatory changes in the U.S., rise of Digital Asset Treasuries (DAT), adoption of AI and tokenization of Real-World-Assets (RWA).