Gold Price Forecast: XAU/USD holds steady above $1,850, Fed rate hike bets cap gains
- Gold snaps five-day uptrend to step back from the highest levels since June.
- Market sentiment dwindles as US banking holiday restricts bond moves.
- Evergrande, Fed rate hike and Sino-American phase 1 deal in focus.
- Gold Price Forecast: XAU/USD jumps with US inflation, more gains in the docket

Update: Following the previous day's late pullback from five-month tops, gold attracted fresh buying on Thursday and was last seen hovering around the $1,855 region. Wednesday's data showed that the US CPI accelerated to the highest level in three decades. This was seen as a key factor that extended some support to the XAU/USD, which is considered a perfect hedge against rising inflation. Apart from this, a generally softer tone around the equity markets further underpinned the safe-haven gold.
That said, prospects for an early policy tightening by the Fed could cap any meaningful gains for the non-yielding yellow metal. Investors now seem convinced that the Fed would be forced to adopt a more aggressive policy response to contain stubbornly high inflation. This was reinforced by the overnight massive rally in the US Treasury bond yields, which assisted the US dollar to hold steady near the highest level since July 2022. A stronger greenback might further act as a headwind for dollar-denominated commodities, including gold.
Apart from this, relatively thin liquidity conditions, on the back of the US bank holiday in observance of Veterans Day, warrant some caution before positioning for any meaningful intraday gains. Nevertheless, gold, so far, has managed to hold in the positive territory for the sixth successive day.
Previous update: Gold (XAU/USD) bulls step back from multi-month high, down 0.26% intraday around $1,848 during a quiet Asian session on Thursday.
The metal jumped to its highest level in five months, also crossed the key upside hurdles near $1,832-34, after the US Consumer Price Index (CPI) jumped to the 30-year high of 6.2% YoY and bolstered Fed rate hike expectations. However, an off-day in the US bond markets limits the market’s reaction.
Even so, talks that China’s struggling real-estate major Evergrande has officially defaulted join the Sino-American tussles over the Phase 1 deal ahead of the next week's summit between US President Biden and his Chinese counterpart Xi Jinping challenge market sentiment. The same highlights gold’s safe-haven demand and put a floor beneath the latest weakness.
That said, a German market screening agency DMSA (Deutsche Marktscreening Agentur) is up for official notification of Evergrande’s bankruptcy after the Chinese firm missed the latest coupon payment. On the other hand, US Trade Representative (USTR) Katherine Tai cited weakness in China’s phase 1 performance.
Amid these plays, the S&P 500 Futures print mild gains while stocks in Asia-Pacific remain sidelined. It’s worth noting that the US 10-year Treasury yields posted the biggest daily jump in seven weeks, around 1.57%, the previous day.
Moving on, headlines concerning China and Evergrande may entertain gold traders amid a light calendar and US banking holiday. However, a successful break of the key upside barrier and the Fed rate hike chatters can favor buyers.
Technical analysis
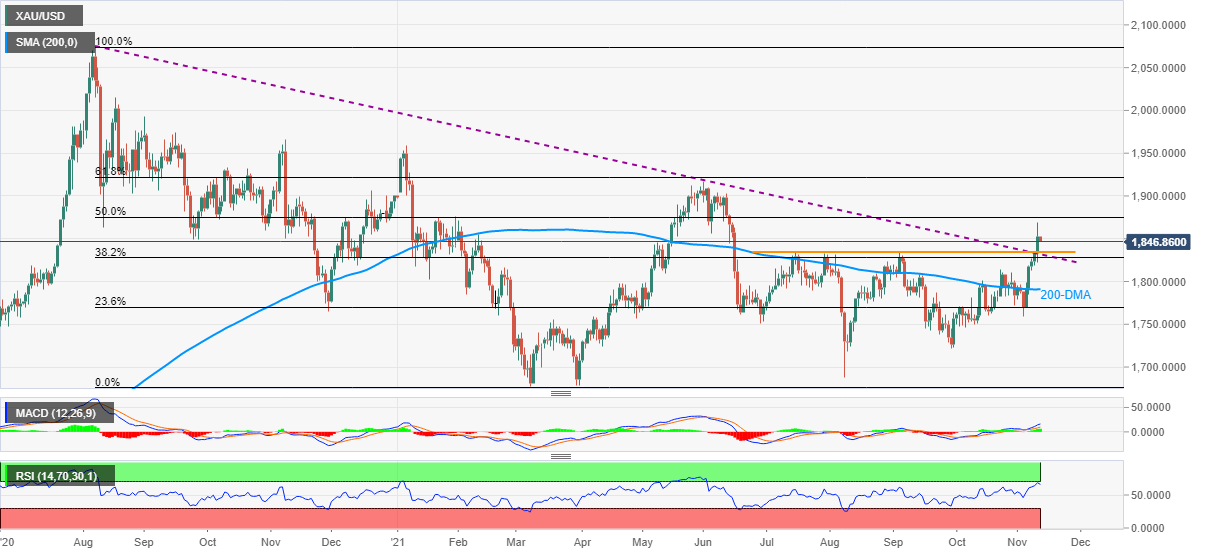
Gold buyers finally managed to cross the $1,832-34 key resistance comprising a 15-month-old descending trend line and a horizontal region comprising highs marked in July and September.
This, in turn, allows them to probe the 50% retracement of a downturn from August 2020 to March 2021, near $1,875. Though, a daily closing beyond the immediate resistance around $1,850, including lows marked in September and November 2020, becomes necessary for the bulls to keep marching higher.
It should be noted, however, that the RSI conditions are close to the overbought limits and hence further advances may require a pullback. The same highlights the early June’s low near $1,856 as an additional filter to the north.
Meanwhile, gold sellers may not risk entries, not even for the short-term, until the quote stays beyond $1,832, a break of which will need validation from the 38.2% Fibo. level close to $1,828.
Even if the gold prices drop below $1,828, October’s high surrounding $1,813 and the $1,800 threshold will be key challenges for the bears before targeting the 200-DMA level around $1,790.
Gold: Daily chart
Trend: Further upside expected
Author

Anil Panchal
FXStreet
Anil Panchal has nearly 15 years of experience in tracking financial markets. With a keen interest in macroeconomics, Anil aptly tracks global news/updates and stays well-informed about the global financial moves and their implications.


