Gold Price Forecast: XAU/USD jumps with US inflation, more gains in the docket

XAU/USD Current price: $1,856.13
- US inflation was confirmed at 6.2% YoY in October, much higher than expected.
- Treasury yields soared with US CPI figures, market participants nervous amid a flattening curve.
- XAU/USD is trading at levels last since June and is poised to run beyond $1,900.00.
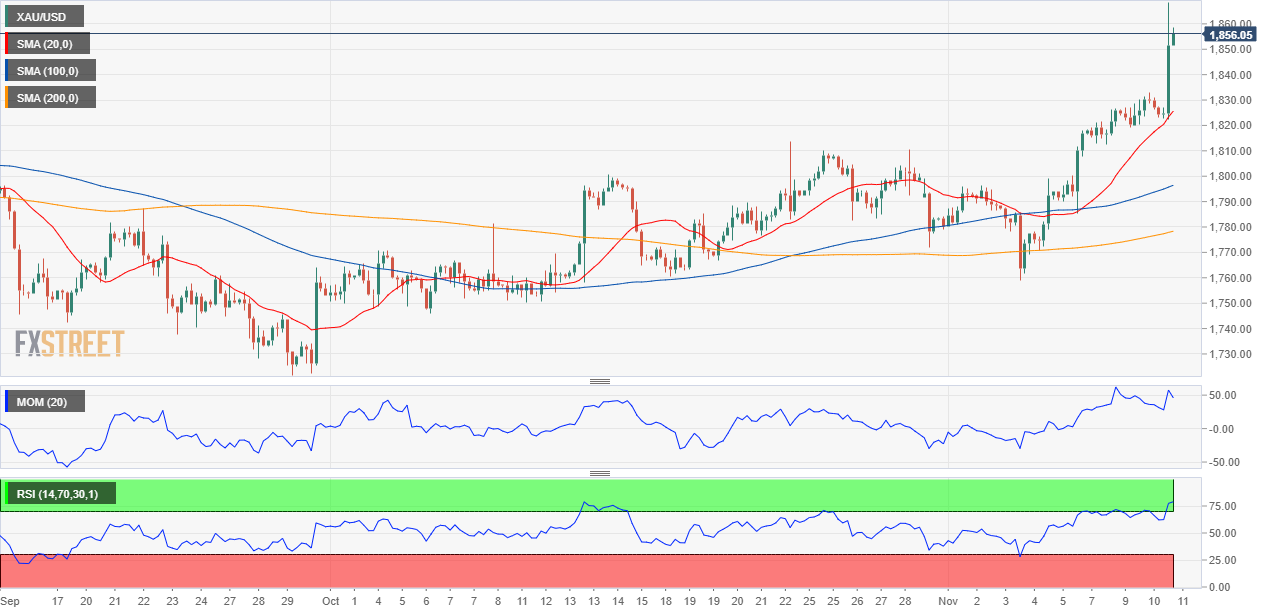
Gold hit a fresh multi-month high of $1,868.54 a troy ounce, its highest since last June. The bright metal soared following the release of higher-than-anticipated US inflation spurring speculation the US Federal Reserve will have no choice but to hike rates sooner. XAU/USD retreated from the mentioned high on the broad dollar’s demand, but retains most of its intraday gains and currently trades in the 1,850 price zone.
The US Bureau of Labor Statistics reported that the US Consumer Price Index surged to 6.2% YoY in October from 5.4% in September, while core inflation in the same period jumped to 4.6% from 4.0%. US Treasury yields initially hesitate, but finally broke higher, with that on the 10-year US Treasury note adding 8bps to currently stand at 1.52%. On the other hand, Wall Street trades in the red, although at this point, losses are moderated.
Additionally, the US reported shrinking Initial Jobless Claims. According to the weekly report, the number of those falling for unemployment contracted to 267K in the week ended November 5, another hint at a tighter monetary policy in the US. The US dollar index is firmly up, currently at 94.53, flirting with multi-month tops.
Gold price short-term technical outlook
XAU/USD is up for a fifth consecutive day, overbought but poised to extend its advance. In the daily chart, technical indicators head firmly higher, in extreme levels last seen in May this year, as t he price further advanced beyond its moving averages. On these last, the 20 SMA is extending its advance beyond the longer ones, reflecting the increased buying interest.
Gold is extremely overbought also in the near term, as the 4-hour chart shows that the RSI is currently at 77, easing from its intraday high of 81. The Momentum indicator has lost its bullish strength, modestly retreating from its daily peak. At the same time a bullish 20 SMA, provided intraday support, currently at 1,825.75. Nevertheless, bulls are still in control of the bright metal that could retest the high set in June at 1,916.50.
Support levels: 1,844.30 1,833.95 1,819.30
Resistance levels: 1,868.54 1,883.00 1,895.20
Premium
You have reached your limit of 3 free articles for this month.
Start your subscription and get access to all our original articles.
Author

Valeria Bednarik
FXStreet
Valeria Bednarik was born and lives in Buenos Aires, Argentina. Her passion for math and numbers pushed her into studying economics in her younger years.