Gold Price Forecast: XAU/USD bulls flex muscles as Federal Reserve announcements loom
- Gold price grinds higher after crossing fortnight-old trading range.
- US Dollar retreat favors XAU/USD upside amid looming United States default fears, banking woes.
- Mixed US data, contradictory updates from major central banks test USD bulls.
- Gold price upside hinges on Federal Reserve’s policy pivot clues as 0.25% rate hike is given.

Gold price (XAU/USD) seesaws at the highest levels in two weeks, making rounds to $2,015-20 during early Wednesday, after rising the most in a month the previous day.
In doing so, the precious metal portrays the market’s cautious mood ahead of today’s top-tier United States data and the Federal Open Market Committee (FOMC) monetary policy meeting announcements. It’s worth noting that mixed US data joined fears surrounding the US default and banking turmoil to propel the XAU/USD prices of late.
Gold price remains firmer on mixed United States data, US default fears
Gold price cheers a technical breakout, backed by downbeat US Dollar, around the higher levels in 13 days. That said, the US Dollar Index (DXY) renews its intraday low near 101.85 while extending the previous day’s U-turn from a three-week high amid softer employment signals and increasing odds of the US default.
Talking about the data, United States Factory Orders for March improved to 0.9% versus 0.8% expected and -1.1% (revised) previous readings. However, the US JOLTS Job Openings for the said month eased to 9.59M from 9.974M prior and 9.775M market forecasts. It’s worth noting that the easing of the US Gross Domestic Product (GDP) joined mixed ISM PMI details to prod the DXY bulls previously and favor the Gold buyers. However, upbeat inflation clues defend the Federal Reserve hawks, which in turn suggests the US central bank is all set for a 0.25% rate hike. As a result, traders are more interested in hearing about the Fed’s policy pivot, previously anticipated to take place in 2023, for clear XAU/USD guidance.
Also read: FOMC Meeting Preview: Powell to keep every door open, surprises not out of the table after RBA
On the other hand, fresh selling of PacWest Bancorp and Western Alliance Bancorp shares triggered banking fears across the board and put a floor under the US Dollar price, especially amid hawkish Fed bets, which in turn prod Gold buyers. Additionally weighing on the market sentiment and challenging the XAU/USD bulls could be the US policymakers’ struggle to avoid debt ceiling expiration, looming in June versus previous expectations of July expiry.
“Top US Senate Republicans on Tuesday called on President Joe Biden to accept their party's debt-ceiling package or make a counter-offer, while a top Democrat said the Senate might try to advance a "clean" debt-ceiling hike next week,” said Reuters.
Doubts over Federal Reserve’s rate hike favor XAU/USD bulls
Apart from the United States data and fears of US debt ceiling expiration, challenges to the Federal Reserve’s (Fed) rate hike from the latest moves of the central bank also allow the Gold price to remain firmer.
In its latest Bank Lending Survey (BLS), the European Central Bank (ECB) noted that a net 38% of Eurozone banks reported a fall in demand for credit from companies in the first quarter of the year, which in turn suggests negative impact of the rate hikes on the credit conditions. The same indirectly challenges the hawkish Fed bias. On the same line could be the hesitance of the Bank of Canada to increase the benchmark rates.
Alternatively, the Reserve Bank of Australia (RBA) surprised markets with a 0.25% rate hike and trigger a fresh round of hawkish expectations from other major central banks. Further, the Bank of England’s (BoE) more than 10% inflation and the Swiss National Bank’s (SNB) determination to tame price pressure keep the rate hike woes on the table and challenge the Gold price upside.
IMF’s Asia-Pacific optimism favors Gold price upside
As per the latest International Monetary Fund (IMF) report, “Asia's economy is expected to expand 4.6% this year after a 3.8% increase in 2022, contributing around 70% of global growth.” The global lender also said that Asia and Pacific will be the most dynamic of the world's major regions in 2023, predominantly driven by the buoyant outlook for China and India. Given the Asian region’s dominance in Gold demand, optimism for the bloc propels the metal price.
Gold price technical analysis
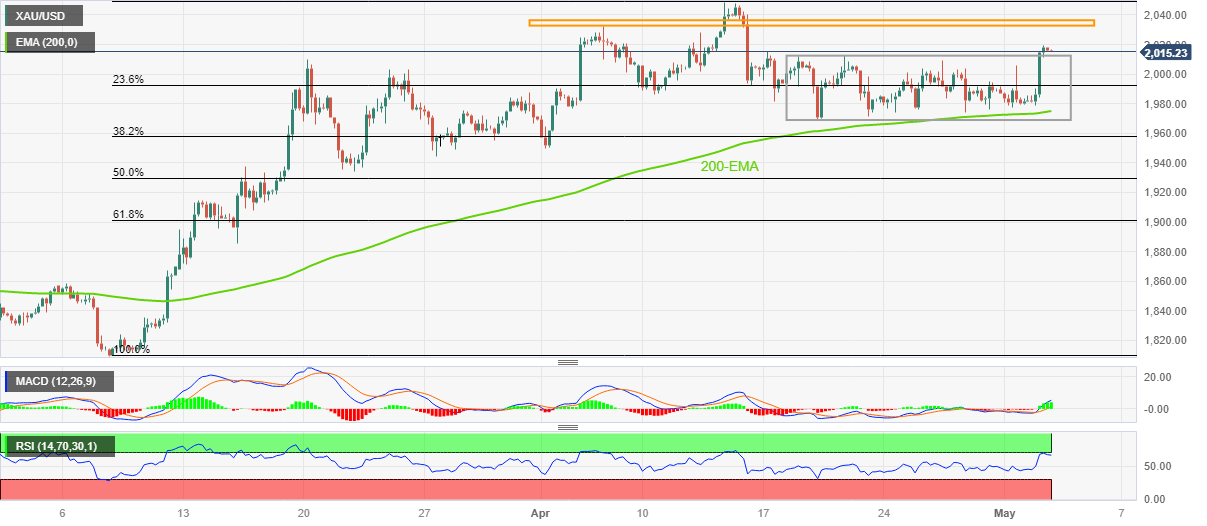
Gold price stays firmer past a fortnight-old trading range between $2,013 and $1,969. The precious metal’s recent upside also takes clues from sustained trading beyond the 200-bar Exponential Moving Average (EMA), as well as bullish signals from the Moving Average Convergence and Divergence (MACD) indicator.
However, the Relative Strength Index (RSI) line, placed at 14, approaches the overbought territory, which in turn suggests a pullback in the XAU/USD prices.
As a result, a sustained upside break of the $2,013 hurdle, comprising the upper line of the aforementioned short-term trading range, isn’t an open welcome for Gold buyers. That said, a one-month-old horizontal resistance area around $2,032-36 and the Year-To-Date high of near $2,049 can prod the XAU/USD bulls before giving them control.
Meanwhile, the $2,000 round figure and the 200-EMA level of $1,973 precedes the stated trading range’s lower limit of near $1,969 to restrict short-term Gold price downside.
Following that, multiple hurdles near $1,950 and $1,935 can challenge the XAU/USD bears, a break of which could convince the Gold sellers to prod the $1,900 round figure.
Overall, the Gold price remains on the bull’s radar as the Federal Reserve (Fed) rate hike looms.
Gold price: Four-hour chart
Trend: Limited upside expected
Author

Anil Panchal
FXStreet
Anil Panchal has nearly 15 years of experience in tracking financial markets. With a keen interest in macroeconomics, Anil aptly tracks global news/updates and stays well-informed about the global financial moves and their implications.


