Gold Price Forecast: XAU/USD bears remain in control whilst below $1,932 – Confluence Detector
- Gold price fades the rebound amid an uptick in the US Treasury yields.
- US dollar weakness could cap the downside in gold price amid Ukraine uncertainty.
- Gold Price Forecast: XAU/USD’s rebound appears limited, focus on ADP, yields.

The fate of gold price remains in the hands of sellers so far this week, as the sentiment in the bond markets and incoming Ukraine headlines continue to remain the main drivers. Inflation concerns are back in play, pushing yields across the globe higher, reducing the demand for non-yielding gold, despite a broad meltdown in the US dollar. Uncertainty over the Ukraine conflict is also weighing on the market mood, which could keep the downside limited in gold price. Attention now shifts towards the key US employment data.
Read: US ADP Employment March Preview: Private job creation slows while yield curve flattens
Gold Price: Key levels to watch
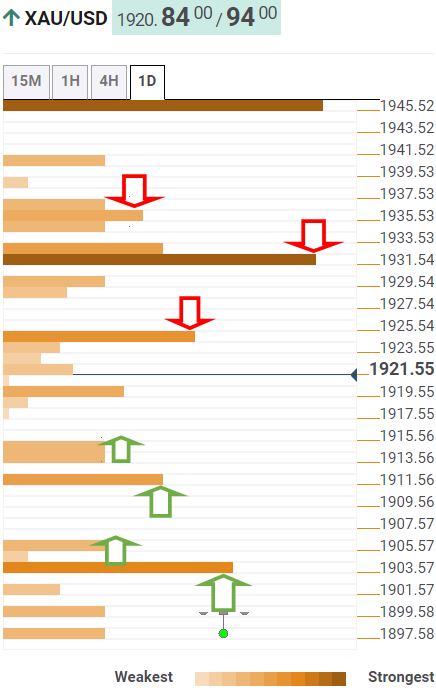
The Technical Confluences Detector shows that gold price is headed south once again, eyeing the critical Fibonacci 61.8% at $1,914.
The previous week’s low at $1,911 will be next on the test, below which the downside could accelerate towards $1,903, the Fibonacci 38.2% one-month.
The last line of defense for gold bulls is seen at around $1,897, the confluence of the pivot point one-day S1 and Fibonacci 23.6% one-day.
Alternatively, the pivot point one-week S1 at $1,925 is the immediate supply zone, beyond which the next bullish target is seen at the previous day’s high of $1,929.
Gold bulls need acceptance above the $1,932 to unleash the additional recovery. At that point, the SMA200 four-hour, Fibonacci 23.6% one-month and Fibonacci 61.8% one-week converge.
Further up, a fierce cap awaits at $1,937, the pivot point one-day R1 and SMA5 one-day intersection.
Here is how it looks on the tool
About Technical Confluences Detector
The TCD (Technical Confluences Detector) is a tool to locate and point out those price levels where there is a congestion of indicators, moving averages, Fibonacci levels, Pivot Points, etc. If you are a short-term trader, you will find entry points for counter-trend strategies and hunt a few points at a time. If you are a medium-to-long-term trader, this tool will allow you to know in advance the price levels where a medium-to-long-term trend may stop and rest, where to unwind positions, or where to increase your position size.
Author

Dhwani Mehta
FXStreet
Residing in Mumbai (India), Dhwani is a Senior Analyst and Manager of the Asian session at FXStreet. She has over 10 years of experience in analyzing and covering the global financial markets, with specialization in Forex and commodities markets.


