Gold Price Forecast: XAU/USD bears eye $1819 and $1814 as NFP effect fades – Confluence Detector
- Gold price corrects as USD claws back post-NFP gains.
- Stimulus hopes and covid woes keep gold price underpinned.
- Gold bulls remain in control following dismal NFP data.

Gold price is consolidating its retreat from two-month highs of $1834, as the bulls continue to remain hopeful, despite the impressive US dollar rebound and the risk-on market mood. The change in expectations towards an extended period of monetary policy support likely from the Fed and China combined with looming covid concerns is keeping the buoyant tone intact around gold price. Meanwhile, investors are taking profits off the table after Friday’s $20 rally and ahead of this week’s ECB monetary policy meeting.
Read: Gold Price Forecast: Why $1850 appears the next bullish target for XAU/USD?
Gold Price: Key levels to watch
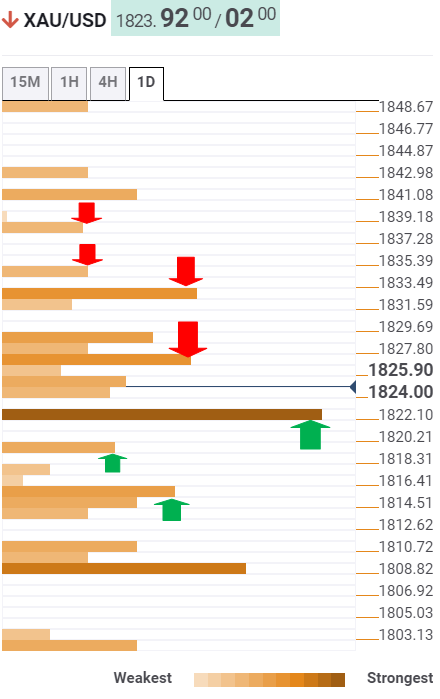
The Technical Confluences Detector shows that gold price is testing the powerful defense line at $1822, as it extends its pullback.
That level is the confluence of the SMA10 four-hour and Fibonacci 38.2% one-week.
The next relevant cushion is seen at the intersection of the SMA50 one-hour and Fibonacci 61.8% one-day at $1819.
Further south, the bears will challenge a dense cluster of support levels around $1814, where SMA100 one-day, pivot point one-day S1 and Fibonacci 61.8% one-week meet.
On the flip side, the buying resurgence could drive gold price back towards the $1827/29 supply zone, which is the convergence of the Fibonacci 23.6% one-day, the previous high four-hour and Fibonacci 23.6% one-week.
The previous month’s high at $1832 could test the bullish interests, above which the previous day’s high and July tops at $1834 could be back in focus.
Buyers will then target the pivot point one-day R1 at $1838.
Here is how it looks on the tool
About Technical Confluences Detector
The TCD (Technical Confluences Detector) is a tool to locate and point out those price levels where there is a congestion of indicators, moving averages, Fibonacci levels, Pivot Points, etc. If you are a short-term trader, you will find entry points for counter-trend strategies and hunt a few points at a time. If you are a medium-to-long-term trader, this tool will allow you to know in advance the price levels where a medium-to-long-term trend may stop and rest, where to unwind positions, or where to increase your position size.
Author

Dhwani Mehta
FXStreet
Residing in Mumbai (India), Dhwani is a Senior Analyst and Manager of the Asian session at FXStreet. She has over 10 years of experience in analyzing and covering the global financial markets, with specialization in Forex and commodities markets.


