Gold Price Forecast: Why $1850 appears the next bullish target for XAU/USD?
- Gold price eases off NFP-led highs, as the US dollar rebounds, stocks advance.
- Stimulus expectations likely to keep gold bulls hopeful amid light trading.
- Gold’s daily chart points to more upside towards $1850, $1864.

Gold price ended the previous week with a bang after rallying nearly $20 on Friday, booking a fourth straight weekly gain. Gold price jumped to fresh two-month highs at $1834 before retracing slightly to finish the week at $1827. Friday’s US Nonfarm Payrolls (NFP) missed estimates by a big margin, arriving at 235K vs. 750K expected, which instantly smashed the Federal Reserve’s (Fed) tapering expectations as well as the US dollar across the board. Gold tends to benefits in times of an era of easy monetary policy. However, a sudden rebound in the US 10-year Treasury yields limited the gold’s upside, as markets digested the slowdown in the American employment sector amid a surge in the Delta covid cases. Meanwhile, the200-Daily Moving Average (DMA) support at $1809 guarded the bullish potential.
Starting out a fresh week on Monday, gold price is easing from two-month tops, posting small losses so far, as the bulls take a breather in the aftermath of the NFP shocker. Investors cheer an extended period of monetary support amid the Chinese economic slowdown and faltering US labor market recovery, lifting Asian stocks at gold’s expense. Further, the US dollar attempts to find its feet, exerting downward pressure on the yellow metal. However, the downside appears limited, as dip-buyers could emerge amid a potentially bullish structure on the technical graph. Also, its worth noting that Labor Day holiday in the US and Canada could exaggerate the moves in gold price.
Gold Price Chart - Technical outlook
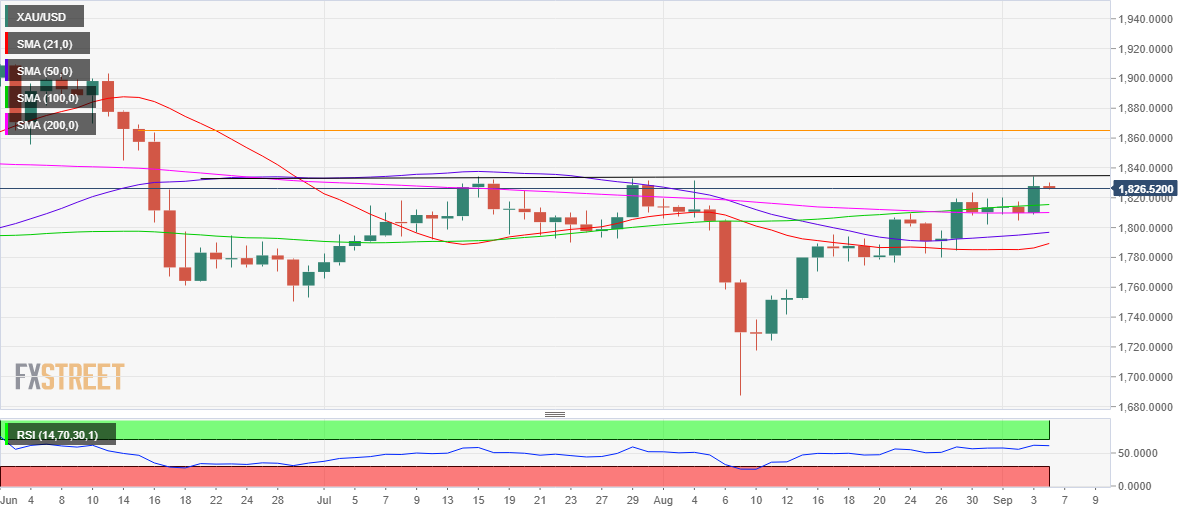
Gold: Daily chart
As observed on the daily chart, gold price needs a sustained break above the July 15 high of $1834.17 to unleash the additional upside towards the June 16 highs of $1865.
The $1850 psychological barrier could test the bearish commitments on its way up. The 14-day Relative Strength Index (RSI) has eased off higher levels, although holds above the midline, suggesting that the broader uptrend remains well in place.
However, gold price could pull back towards the 100-DMA at $1815 before resuming the next upswing. The 200-DMA at $1809 is the last line of defense for gold bulls.
Premium
You have reached your limit of 3 free articles for this month.
Start your subscription and get access to all our original articles.
Author

Dhwani Mehta
FXStreet
Residing in Mumbai (India), Dhwani is a Senior Analyst and Manager of the Asian session at FXStreet. She has over 10 years of experience in analyzing and covering the global financial markets, with specialization in Forex and commodities markets.


