Gold Price Forecast: XAU/USD bears eye $1,820 and US inflation clues – Confluence Detector
- Gold price clings to important support confluence amid mixed sentiment.
- Risks dwindle as Ukraine-Russia war drags to the second year with no solution in sight.
- Upbeat US data, hawkish Fed bets struggle to defend US Dollar bulls amid sluggish yields.
- XAU/USD bears can cheer upbeat US Core PCE Price Index as markets price in three more rate hikes of 0.25%.

Gold price (XAU/USD) prints mild gains as it consolidates the weekly loss, the fourth one in a row, ahead of the US Federal Reserve’s (Fed) preferred inflation gauge. In doing so, the precious metal prints the first daily gains in five while probing the bears at the lowest levels in 2023.
While tracing the catalysts, a pullback in the US Treasury bond yields and sluggish US Dollar could be held responsible as the bond bears retreat while the US Dollar Index (DXY) snaps a three-day uptrend near a seven-week high.
Market sentiment dwindles on mixed headlines surrounding China, due to its peace plan for Ukraine and ties with Russia, as well as due to the US-China readiness for trade talks, despite not sharing the details and criticizing each other on various issues.
It should be noted that the market’s fears that the strong US data and further Federal Reserve (Fed) rate hikes are already priced in seemed to have weighed on the US Treasury bond yields and favored the XAU/USD rebound. “Fed funds futures are priced for 25 basis-point (bp) hikes over the next three meetings, with a peak rate of 5.36% hitting in July,” per Reuters. The same highlights today’s Fed’s preferred inflation gauge, namely the US Personal Consumption Expenditures (PCE) Price Index data for January.
Also read: Gold Price Forecast: XAU/USD keeps marching toward $1,800
Gold Price: Key levels to watch
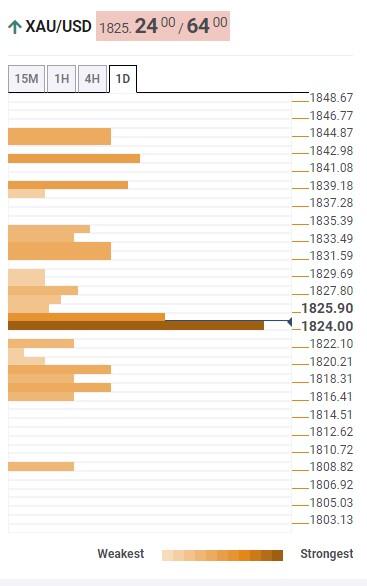
The Technical Confluence Detector shows that the Gold price clings to the key $1,823 support level comprising the Fibonacci 38.2% on one-day, the previous monthly low and middle band of the Bollinger on the hourly play.
Should the quote breaks the $1,823 support confluence, the lower band of the Bollinger on the four-hour and previous weekly low can challenge the Gold bears near $1,820.
Also acting as a downside filter is the Pivot Point one-week S1 and previous daily low, close to $1,817.
Should the quote drops below $1,817, there prevails a smooth road toward the $1,800 threshold.
Meanwhile, Fibonacci 23.6% on one-week joins 5-DMA and Pivot Point one-day R1 to highlight multiple resistances surrounding $1,830-33.
Following that, Pivot Point one-day R2 and 10-DMA highlight $1,843 as the last defense of the Gold bears.
Here is how it looks on the tool
About Technical Confluences Detector
The TCD (Technical Confluences Detector) is a tool to locate and point out those price levels where there is a congestion of indicators, moving averages, Fibonacci levels, Pivot Points, etc. If you are a short-term trader, you will find entry points for counter-trend strategies and hunt a few points at a time. If you are a medium-to-long-term trader, this tool will allow you to know in advance the price levels where a medium-to-long-term trend may stop and rest, where to unwind positions, or where to increase your position size.
Author

Anil Panchal
FXStreet
Anil Panchal has nearly 15 years of experience in tracking financial markets. With a keen interest in macroeconomics, Anil aptly tracks global news/updates and stays well-informed about the global financial moves and their implications.


