Gold Price Forecast: XAU/USD bears are gaining ground, $1,885 critical support – Confluence Detector
- Gold has been unwinding the war-related gains, dropping under $1,900.
- Critical support awaits at $1,885, followed only by $1,868.
- Resistance is at $1,899, then $1,902, if the precious metal recovers.

Will hostilities end in Ukraine? Russia's offer to talk in Minsk has been underpinning a market recovery. The move to stocks from bonds means lower yields, which in turn, has pushed gold lower.
How is gold positioned on the technical chart?
Gold Price: Key levels to watch
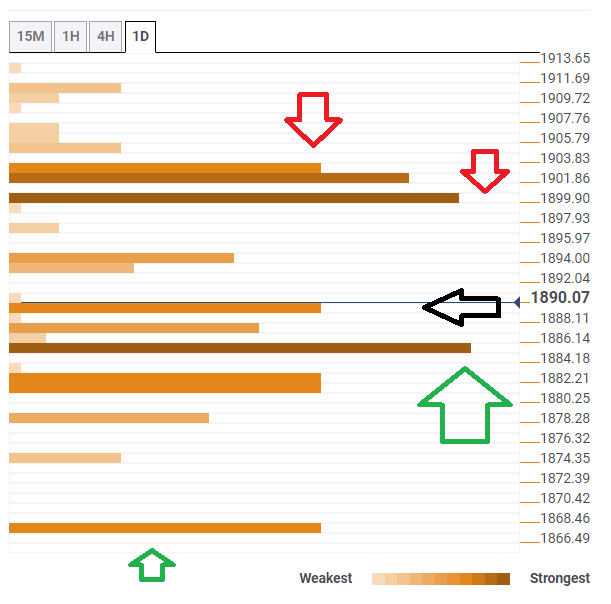
The Technical Confluences Detector is showing that gold is struggling around $1,889, which is the convergence of the Fibonacci 23.6% one-week and the SMA 5-15m.
Looking down, $1,885 is a juncture of lines including the Pivot Point one-month Resistance 2 and the 10-day Simple Moving Average. It is critical support.
Looking down, the next level to watch is $1,868, which is where the Fibonacci 61.8% one-week hits the price.
Resistance is at $1,899, which is the confluence of the Bollinger Band 15min-Middle and the Fibonacci 161.8% one-month.
Close by, $1,902 is another tough cap, which is where the Fibonacci 23.6% one-day and the 5-day SMA converge.
XAU/USD Confluence levels
About Technical Confluences Detector
The TCD (Technical Confluences Detector) is a tool to locate and point out those price levels where there is a congestion of indicators, moving averages, Fibonacci levels, Pivot Points, etc. If you are a short-term trader, you will find entry points for counter-trend strategies and hunt a few points at a time. If you are a medium-to-long-term trader, this tool will allow you to know in advance the price levels where a medium-to-long-term trend may stop and rest, where to unwind positions, or where to increase your position size.
Author

Yohay Elam
FXStreet
Yohay is in Forex since 2008 when he founded Forex Crunch, a blog crafted in his free time that turned into a fully-fledged currency website later sold to Finixio.


