|

Gold Price Forecast: XAU/USD aims to shift auction profile above $1,840 ahead of Fed minutes

  • Gold price is looking to shift its business above $1,840.00 after an Ascending Triangle breakout.
  • The US Dollar Index has attempted a recovery after dropping to near 103.15.
  • Higher interest rates by the Fed could be responsible for weaker consensus for US ISM PMI data.

Gold price (XAU/USD) has displayed a sheer north-side move after surpassing the critical resistance of $1,823.00 in the Asian session. The precious metal is aiming to shift its auction profile above the $1,840.00 resistance amid a decline in safe-haven’s appeal.

A sheer recovery move in the S&P500 futures has shifted the traction towards the risk appetite theme. Meanwhile, the US Dollar Index (DXY) has attempted a rebound after dropping to near the crucial support at 103.15. Investors should brace for volatility in the FX domain ahead of the release of Wednesday’s United States ISM Manufacturing PMI data (Dec). According to the estimates, the economic data will drop to 48.5 vs. the former release of 49.0.

The reasoning behind lower consensus for ISM PMI data could be the higher interest rates by the Federal Reserve (Fed) due to which firms have postponed their expansion plans to avoid higher interest obligations.

Apart from the Manufacturing PMI, the release of the Federal Open Market Committee (FOMC) minutes will hog the limelight. Investors will keenly observe the economic projections and cues about the monetary policy outlook for CY2023.

Gold technical analysis

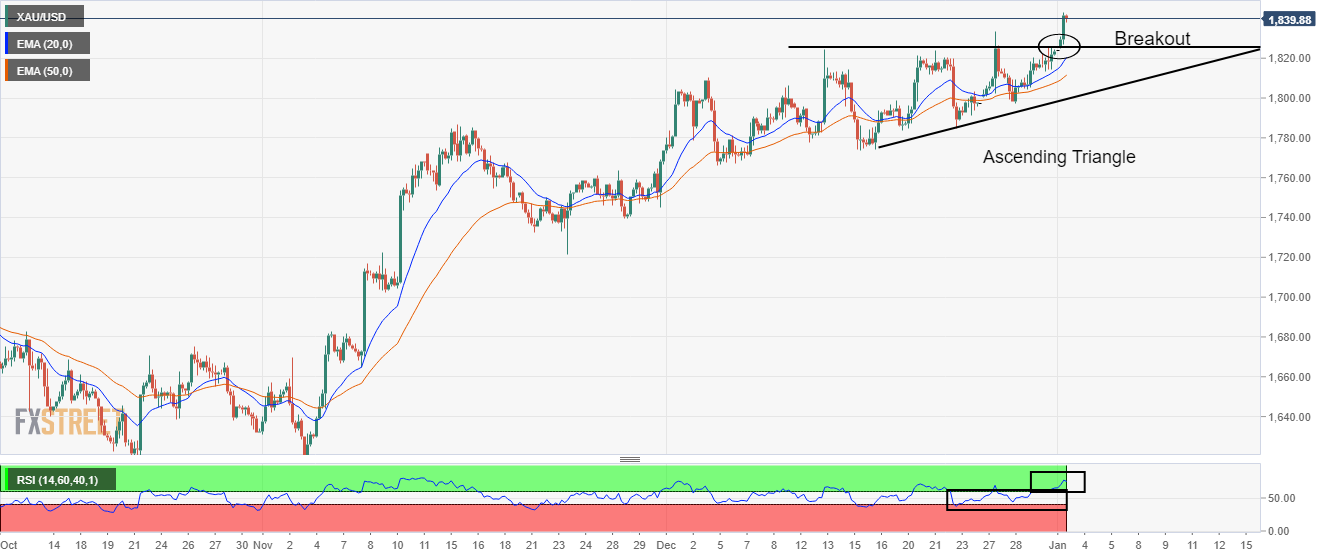
Gold price has delivered a breakout of the Ascending Triangle chart pattern formed on a four-hour scale. The horizontal resistance of the aforementioned chart pattern is placed from December 13 high at $1,824.55 while the upward-sloping trendline is plotted from December 16 low at $1,774.36.

Advancing 20-and 50-period Exponential Moving Averages (EMAs) at $1,820.00 and $1,812.07 respectively add to the upside filters.

Meanwhile, the Relative Strength Index (RSI) (14) has shifted into the bullish range of 60.00-80.00 from the 40.00-60.00 range, which indicates more upside ahead.

Gold four-hour chart

XAU/USD

Overview
Today last price1838.21
Today Daily Change14.45
Today Daily Change %0.79
Today daily open1823.76
 
Trends
Daily SMA201799.73
Daily SMA501753.32
Daily SMA1001723.46
Daily SMA2001779.69
 
Levels
Previous Daily High1823.76
Previous Daily Low1823.76
Previous Weekly High1833.38
Previous Weekly Low1797.11
Previous Monthly High1833.38
Previous Monthly Low1765.89
Daily Fibonacci 38.2%1823.76
Daily Fibonacci 61.8%1823.76
Daily Pivot Point S11823.76
Daily Pivot Point S21823.76
Daily Pivot Point S31823.76
Daily Pivot Point R11823.76
Daily Pivot Point R21823.76
Daily Pivot Point R31823.76

Author

Sagar Dua

Sagar Dua

FXStreet

Sagar Dua is associated with the financial markets from his college days. Along with pursuing post-graduation in Commerce in 2014, he started his markets training with chart analysis.

More from Sagar Dua
Share:

Editor's Picks

GBP/USD slides to fresh low since April amid UK political crisis

The GBP/USD pair attracts some follow-through selling for the third straight day and weakens further below the 1.3200 mark, hitting a fresh low since April during the Asian session on Friday. Spot prices remain on track to register heavy weekly losses, and the fundamental backdrop suggests that the path of least resistance remains to the downside.

EUR/USD drifts higher above 1.1450 as US, Iran sign initial agreement to end war

The EUR/USD pair recovers some lost ground near 1.1460, snapping the two-day losing streak during the early Asian session on Friday. The Euro strengthens against the US Dollar (USD) after US President Donald Trump signed a deal with Iran to end the war that has disrupted global energy supplies.

Gold remains a lose-lose trade despite the US-Iran peace deal

Gold extends three-day losing streak below $4,200, eyes third straight weekly loss. The US Dollar sits at yearly highs amid hawkish Fed outlook, renewed Iran tensions. Technically, Gold remains vulnerable, with a retest of $4,000 likely on the cards.

Cardano's Derivatives and on-chain losses compound bearish trend

Cardano (ADA) remains under pressure, trading below $0.165 on Friday, losing over 11% so far this week. Weakening derivatives metrics and deteriorating on-chain data support further correction on ADA. Cardano derivatives metrics support a negative outlook.

 Back above 100: Kevin Warsh’s first Fed meeting sparks US Dollar rally

The US Dollar Index did a phoenix comeback, rising from its ashes and reconquering 100. The reasons behind the US Dollar rally are pretty clear: the Memorandum of Understanding between the United States and Iran, and a hawkish Federal Reserve. Both events were long-awaited and much expected. However, the market reacted with surprise when there were no surprises at all.

The next big AI trade may not be about chips or software

Artificial intelligence has already created some of the biggest winners in modern market history. Chipmakers have surged, data centre construction is booming, and electricity demand forecasts are changing globally.