|

Gold Price Forecast: XAU/USD aims to extend rally above $1,920 as Fed to ease policy tightening pace

  • Gold price is looking to extend gains above $1,920.00 decisively amid weakness in the US Dollar Index (DXY).
  • The Fed is expected to scale down the policy tightening pace amid declining inflation.
  • S&P500 recorded a four-day winning streak, portraying a risk-on market mood.

Gold price (XAU/USD) has turned sideways after a juggernaut rally to near the critical resistance of $1,920.00 in the early Asian session on Monday. The precious metal witnessed substantial buying interest after surpassing the round-level resistance of $1,900 for the first time in eight months. Also, a sell-off in the US Dollar Index (DXY) supported a rally in the Gold price.

The risk profile remains upbeat as S&P500 recorded a four-day winning streak as the Federal Reserve (Fed) is set to trim its current policy tightening pace after a decent decline in December’s inflation report. However, the return generated by US Treasury bonds remains solid and gained to 3.50% despite the risk appetite theme. The US Dollar Index remained below 101.80 despite an improvement in United States Consumer Confidence data on Friday.

The University of Michigan released Consumer Confidence at 64.6 vs. the expectations of 60.5. The street is aware of the fact that retail demand has slowed down, therefore, the catalyst that has cheered consumers is the lower inflation led by lower gasoline prices.

Analysts at Wells Fargo see that the relief on the inflation front and wage growth is lifting spirits, but warn the still-sour buying conditions suggest the good vibes in this report may not translate into a spending surge.

Gold technical analysis

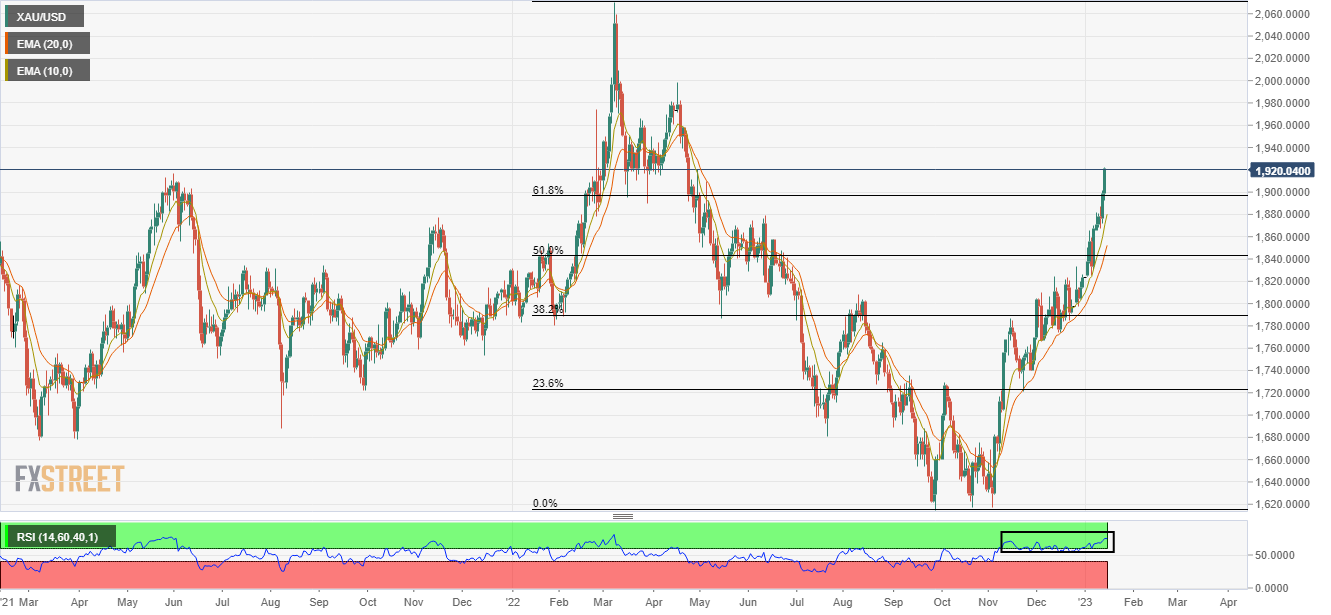
Gold price has scaled above the 61.8% Fibonacci retracement (placed from March 8 high at $2,070.54 to September 28 low at $1,614.85) at $1,897.42. The 10-and 20-period Exponential Moving Averages (EMAs) at $1,881.49 and $1,852.64 respectively are upward-sloping, which adds to the upside filters.

Also, the Relative Strength Index (RSI) (14) is oscillating in the bullish range of 60.00-80.00, which indicates that the upside momentum is active.

Gold daily chart

XAU/USD

Overview
Today last price1920.76
Today Daily Change0.00
Today Daily Change %0.00
Today daily open1920.76
 
Trends
Daily SMA201836.21
Daily SMA501793.04
Daily SMA1001734.08
Daily SMA2001777.12
 
Levels
Previous Daily High1921.96
Previous Daily Low1892.34
Previous Weekly High1921.96
Previous Weekly Low1865.22
Previous Monthly High1833.38
Previous Monthly Low1765.89
Daily Fibonacci 38.2%1910.65
Daily Fibonacci 61.8%1903.65
Daily Pivot Point S11901.41
Daily Pivot Point S21882.07
Daily Pivot Point S31871.79
Daily Pivot Point R11931.03
Daily Pivot Point R21941.31
Daily Pivot Point R31960.65

Author

Sagar Dua

Sagar Dua

FXStreet

Sagar Dua is associated with the financial markets from his college days. Along with pursuing post-graduation in Commerce in 2014, he started his markets training with chart analysis.

More from Sagar Dua
Share:

Editor's Picks

EUR/USD rebounds from session lows, stays below 1.1650

EUR/USD is recovers modestly from session lows but remains in the red below 1.1650 in European trading on Thursday. The pair faces headwinds from a renewed uptick in the US Dollar amid a negative shift in risk sentiment. Surging energy prices due to the Middle East war keep the bearish pressure intact on the Euro. The US Jobless Claims data are next of note. 

GBP/USD stays weak near 1.3350 amid UK stagflation risks

GBP/USD sticks to losses near 1.3350 in the European session on Thursday. The Pound Sterling loses ground amid fears that the United Kingdom economy could face stagflation risks due to higher energy prices, while the US Dollar attracts fresh havem demand ahead of the US Jobless Claims data. 

Gold climbs near $5,200 as Iran war fuels safe-haven demand

Gold price extends its gains for the second successive session on Thursday as traders seek safety amid the ongoing war in the Middle East. US and Israeli strikes across Iranian territory and widespread Iranian missile and drone retaliation across the Middle East, including attacks on regional targets and military sites, prolong the crisis and its impact.

Three reasons to be bearish on Bitcoin

Bitcoin is holding up well taking into account the uncertainty stemming from the Middle East. Despite this week’s rally, the long-term outlook remains bearish. Here are three reasons why I think the storm for the largest cryptocurrency isn't over yet.

FX alert: When Energy still writes the macro script the Dollar holds the pen

The market is quietly sliding back into the trade nobody wanted to own, but everyone now has to respect again. The no quick off-ramp trade. Yesterday’s bounce in risk assets already looks less like a turning point and more like a classic relief rally in a market that briefly inhaled before realizing the room was still on fire.

Cardano Price Analysis: Approaches key trendline amid bearish sentiment

Cardano (ADA) price is approaching its descending trendline around $0.28 at the time of writing, set to shape the next directional move. The derivatives metrics paint a bearish picture, with ADA’s Open Interest continuing to fall and short bets rising among traders.