|

Gold Price Forecast: XAU/USD aims an establishment above $1,710 ahead of US ISM Services PMI

  • Gold price is aiming to shift its auction profile above $1,710.00 despite upbeat US NFP data.
  • The US ISM Services PMI is expected to remain a major event for the week.
  • US markets will remain closed on account of Labor Day.

Gold price (XAU/USD) is auctioning in a minor corrective phase after printing a short-term high of $1,718.00 on Friday. The precious metal extended its gains on Friday after overstepping the psychological resistance of $1,700.00 with much confidence. Investors went gung-ho over the yellow metal despite higher-than-expected US Nonfarm Payrolls (NFP) data.

The US economy created 315k jobs in August vs. the expectation of 300k and the prior release of 526k. No doubt, the economic data remained upbeat against expectations but what kept gold prices going is the decline in the increasing rate of job creation.

 Scrutiny of US NFP indicates that the investors should scale down their expectations for the extent of employment generation. As the US economy is operating at full employment levels for a tad longer period, the employment creation rate curve is displaying exhaustion signals.

Meanwhile, the US dollar index (DXY) has ignored the escalation in the Unemployment Rate and is aiming to capture the psychological resistance of 110.00 sooner. The jobless rate has scaled sharply at 3.7% vs. forecasts and the prior print of 3.5%. Now, the focus has entirely shifted to the US ISM Services PMI data, which is expected to decline to 54.9 against the prior release of 56.7. Investors should be informed that the US markets are closed on account of Labor Day.

Gold technical analysis

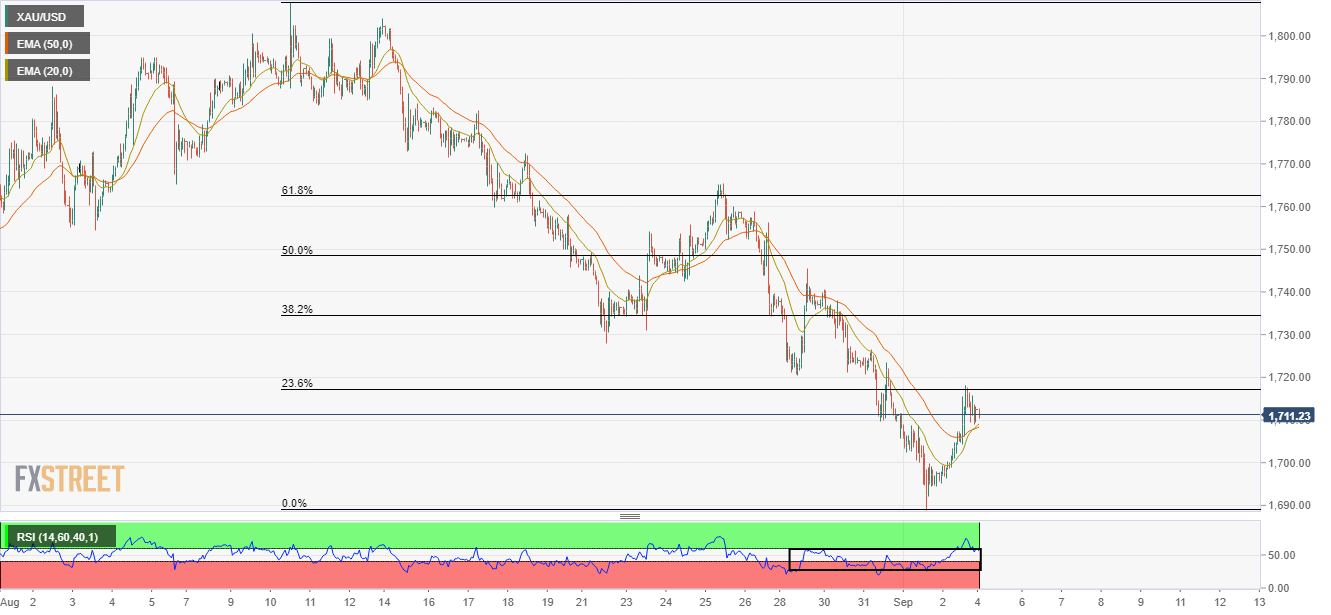
Gold prices have attempted to overstep the 23.6% Fibonacci retracement (placed from August 10 high at $1,807.93 to September 1 low at $1,688.92) at $1,717.24. The 20-and 50-period Exponential Moving Averages (EMAs) have given a bullish crossover at $1,708.15, which adds to the upside filters.

Also, the Relative Strength Index (RSI) (14) has attempted to shift into the bullish range of 60.00-80.00, which indicates a bullish reversal.

Gold hourly chart

XAU/USD

Overview
Today last price1711.15
Today Daily Change-1.33
Today Daily Change %-0.08
Today daily open1712.48
 
Trends
Daily SMA201755.27
Daily SMA501754.28
Daily SMA1001807.79
Daily SMA2001835.21
 
Levels
Previous Daily High1718.02
Previous Daily Low1695.1
Previous Weekly High1745.58
Previous Weekly Low1688.92
Previous Monthly High1807.93
Previous Monthly Low1709.68
Daily Fibonacci 38.2%1709.26
Daily Fibonacci 61.8%1703.86
Daily Pivot Point S11699.05
Daily Pivot Point S21685.61
Daily Pivot Point S31676.13
Daily Pivot Point R11721.97
Daily Pivot Point R21731.45
Daily Pivot Point R31744.89

Author

Sagar Dua

Sagar Dua

FXStreet

Sagar Dua is associated with the financial markets from his college days. Along with pursuing post-graduation in Commerce in 2014, he started his markets training with chart analysis.

More from Sagar Dua
Share:

Editor's Picks

EUR/USD: Cautiously optimistic near 1.1550 ahead of the ECB

EUR/USD extends its weekly recovery for the third day in a row on Wednesday, navigating in a sidelined fashion around 1.1550 on the back of humble losses in the US Dollar. In the meantime, market participants continue to closely follow developments in the Middle East while slowly gearing up for the ECB gathering on Thursday.

GBP/USD recedes from tops, hovers around 1.3400

GBP/USD could not sustain the initial bull run and is now slipping back toward the 1.3400 neighbourhood on Wednesday. Cable’s continuation of the ongoing leg higher follows mild selling pressure on the Greenback, despite steady uncertainty on the geopolitical front and elevated US inflation.

Gold bleeding continues as Middle East crisis escalates, Fed hike coming

Gold is accelerating its downward trends and approaches the area of $4,100 per troy ounce on Wednesday, where the 2026 bottom sits so far. The persistent decline in the precious metal almost exclusively follows the swelling opinion that the Fed will keep a cautious stance in H2, a view that was reinforced following earlier US CPI data.

$1,500: Why Ethereum just crashed 20% despite spot markets barely selling
Ethereum (ETH) recently suffered one of its sharpest declines of 2026, dropping more than 20% and briefly testing the $1,500 area. While the sell-off appeared to reflect broader market fears, derivatives and on-chain data suggest a more complex story may be unfolding beneath the surface.
Brutal sell-off: Silver deepens months-long slide, refocusing on $60

Silver has never been known for its calm temperament. The precious metal can spend weeks grinding higher before suddenly giving back months of gains in a matter of days. That volatile reputation has been on full display in recent weeks.

The US economy defies the rules: 100 days into the Oil shock and the recession signal is still missing

More than three months after the start of the Iran war and the resulting disruption to global energy markets, the US economy continues to display remarkable resilience. The conflict has triggered a sharp rise in Oil prices, reignited inflationary pressures and fueled widespread concerns about a potential economic slowdown.