Gold Price Forecast: Layers of resistances prod XAU/USD rebound below $2,015 – Confluence Detector
- Gold price remains depressed near the lowest levels in two weeks.
- US Dollar recovers amid mixed feelings about debt ceiling negotiations, ignores pullback in yields.
- Light calendar restricts XAU/USD moves, headlines about US default, Fed appear the key catalysts.
- Hawkish Fed talks, upbeat US data keep the Gold price below a short-term key resistance.

Gold price (XAU/USD) grinds near the lowest levels in a fortnight, recently easing from the intraday top, as market sentiment dwindles amid a lack of clarity about the US default conditions.
That said, the recently firmer US data and hawkish Federal Reserve (Fed) commentary allow the US Dollar to ignore a retreat in the Treasury bond yields and remain firmer, which in turn exerts additional downside pressure on the Gold price.
Above all, sour sentiment and the metal’s inability to cross the short-term key upside hurdle keep the XAU/USD bears hopeful, especially amid a light calendar and mixed risk catalysts.
Also read: Gold Price Forecast: ‘Sell the bounce’ in XAU/USD, as technical indicators turn bearish
Gold Price: Key levels to watch
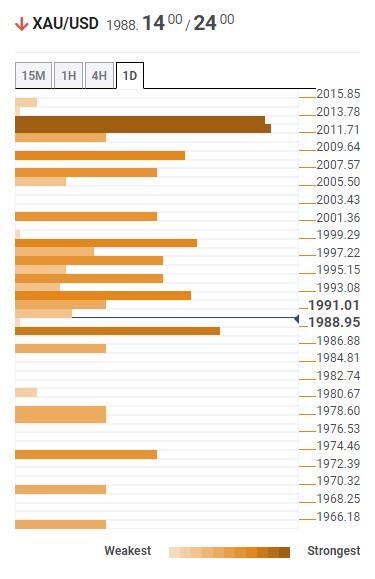
Our Technical Confluence Indicator suggests that the Gold price remains bearish below the key $2,013 resistance confluence comprising the Fibonacci 23.6% on one week, Fibonacci 38.2% on one month and 5-DMA.
That said, the XAU/USD currently prods the $1,987 support encompassing the Fibonacci 61.8% on one month, a break of which could direct the Gold price towards $1,975 support including the Pivot Point one week S2.
Following that, the previous monthly low of around $1,950 will be in the spotlight.
Alternatively, a slew of resistances stands tall to challenge the Gold price recovery before the quote hits the $2,013 key upside hurdle.
Among them, Fibonacci 38.2% on one day around $1,998 and the $2,000 guards the XAU/USD’s immediate rebound.
In a case where the Gold price remains firmer past $2,000, the middle band of the Bollinger on the daily chart, near $2,008, can act as an extra filter ahead of the $2,013 resistance confluence.
It’s worth noting that the $2,050 is a tough nut to crack for the Gold buyers if they manage to keep the reins past $2,013.
Here is how it looks on the tool
About Technical Confluences Detector
The TCD (Technical Confluences Detector) is a tool to locate and point out those price levels where there is a congestion of indicators, moving averages, Fibonacci levels, Pivot Points, etc. If you are a short-term trader, you will find entry points for counter-trend strategies and hunt a few points at a time. If you are a medium-to-long-term trader, this tool will allow you to know in advance the price levels where a medium-to-long-term trend may stop and rest, where to unwind positions, or where to increase your position size.
Author

Anil Panchal
FXStreet
Anil Panchal has nearly 15 years of experience in tracking financial markets. With a keen interest in macroeconomics, Anil aptly tracks global news/updates and stays well-informed about the global financial moves and their implications.