Gold Price Forecast: XAU/USD eyes $1756 and $1750 as the next bearish targets – Confluence Detector
- Gold price extends Friday’s decline amid firmer yields and the US dollar.
- Hawkish Fed’s expectations and higher inflation continue to weigh on gold.
- Gold: Sellers defend $1,800, all eyes on US T-bond yields.

Gold price is looking to extend Friday’s $30 slide on Monday, as the underlying narrative of sooner than expected Fed’s monetary policy normalization to counter inflationary risks continues to play out. An upside surprise to the US Retail Sales data bolstered the hawkish Fed’s bets, leading to an extended rally in the US Treasury yields across the curve. Meanwhile, the buying resurgence in the US dollar, in the face of firmer yields and China slowdown worries-led risk-aversion, also exerts the additional downside pressure on gold price. Looking ahead, gold traders will continue to closely follow the dynamics in the yields and the greenback amid a lack of top-tier US events this week.
Read: Gold Price Forecast: XAU/USD eyes $1750 after rejection at 200-DMA, focus on yields
Gold Price: Key levels to watch
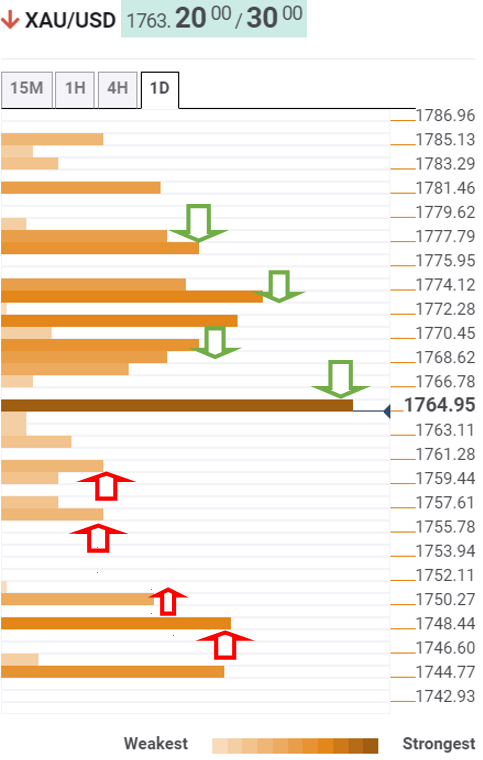
According to the Technical Confluences Detector, gold has breached the critical support at $1765, which is the convergence of the previous day’s low and Fibonacci 38.2% one-month.
Therefore, the sellers eye the next support at $1760, where the SMA100 four-hour merges with the Bollinger Band one-day Middle.
If the bearish momentum accelerates, then the pivot point one-day S1 at $1756 will get challenged.
The additional downside will then open up towards $1750, the previous week’s low, below which the bears will look out for the Fibonacci 23.6% one-month at $1748.
Alternatively, recapturing the abovementioned support-turned-resistance at $1765 is critical for gold buyers to initiate a meaningful recovery towards $1768, the Fibonacci 61.8% one-week.
Up next, the bulls will aim for the $1770 figure, followed by the intersection of the SMA5 one-day, Fibonacci 23.6% one-day and SMA200 four-hour around $1773.
Further up, the level to beat for gold bulls is seen around $1777, where the SMA50 one-day, Fibonacci 38.2% one-day and SMA10 four-hour coincide.
Here is how it looks on the tool
About Technical Confluences Detector
The TCD (Technical Confluences Detector) is a tool to locate and point out those price levels where there is a congestion of indicators, moving averages, Fibonacci levels, Pivot Points, etc. If you are a short-term trader, you will find entry points for counter-trend strategies and hunt a few points at a time. If you are a medium-to-long-term trader, this tool will allow you to know in advance the price levels where a medium-to-long-term trend may stop and rest, where to unwind positions, or where to increase your position size.
Author

Dhwani Mehta
FXStreet
Residing in Mumbai (India), Dhwani is a Senior Analyst and Manager of the Asian session at FXStreet. She has over 10 years of experience in analyzing and covering the global financial markets, with specialization in Forex and commodities markets.


